
Figure 8.
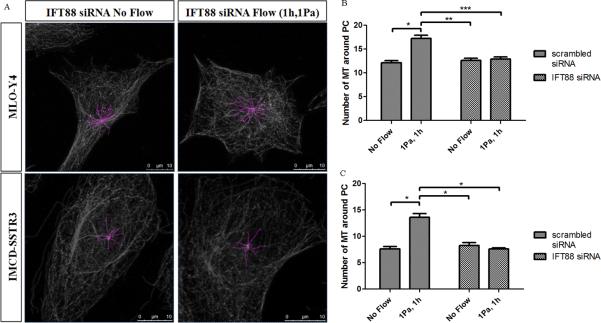
Effects of flow in microtubules at the base of primary cilia without treatment and transfected with IFT88 siRNA. A: Examples of the quantification of microtubules around primary cilia in both cell types after IFT88 siRNA transfection for two different conditions: no flow and 1Pa flow for 1h (pink – microtubules). B,C: Effect of flow in the number of microtubules around primary cilia in IMCD-SSTR3 cells (B) and MLO-Y4 cells (C) without any treatment and transfected with IFT88 siRNA. * indicates values are significantly different (*p<0.001; **p<0.01; ***p<0.05; N≥10).