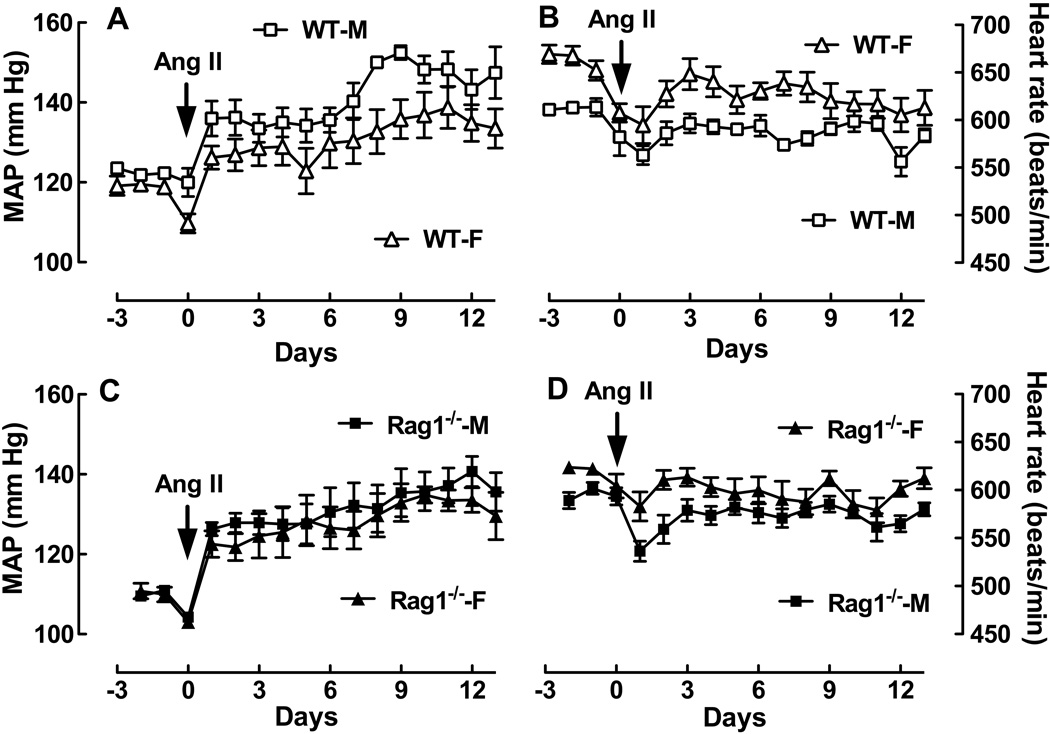
Figure 1. Effect of the sex of the animal on MAP and HR responses to Ang II in WT and Rag1−/− mice.
Shown is MAP (A, C) and HR (B, D) as a function of time in female (triangle) and male (square) WT (opened symbol) and Rag1−/− (closed symbol) mice after Ang II infusion (490 ng/kg/min). WT-M (n=6); WT-F (n=9);Rag1−/−-M (n=7);Rag1−/−-M-F (n=6). See text for statistical comparisons.

