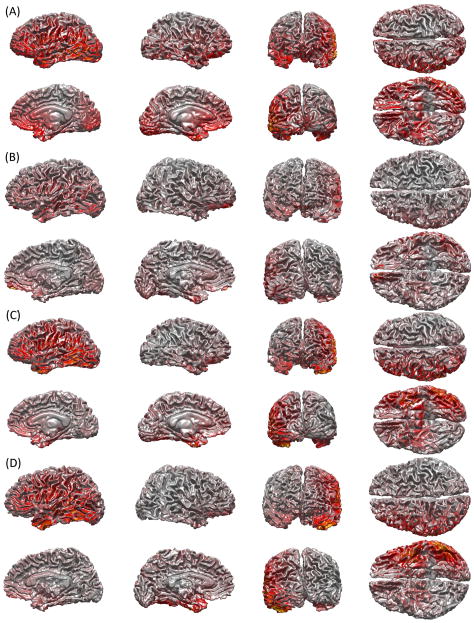
Figure 1.
Cortical LFs for sample sensors illustrating the dependence of MEG sensitivity upon brain size. LFs are shown for sensors located directly above the junction between the sylvian and rolandic fissures. The values are plotted on the WM surface and they represent the absolute values of LF values for the sensor of choice. LFs were normalized with respect to the maximum absolute value of the LF being displayed on each cortical surface. Since the LF specifies the visibility of every source to the sensor, these cortical LF plots indicate how many sources can contribute to the signal recorded by the selected sensor. (A–B) illustrate magnetometer LFs for the subjects with the lowest (A) and highest (B) TBVs, respectively. By contrast, (C–D) display gradiometer LFs for the same subjects as in (A) and (B), respectively. The distance between the sensor and the cortex is equal to 3.12 cm (A) and 4.96 cm (B).

