
Figure 1.
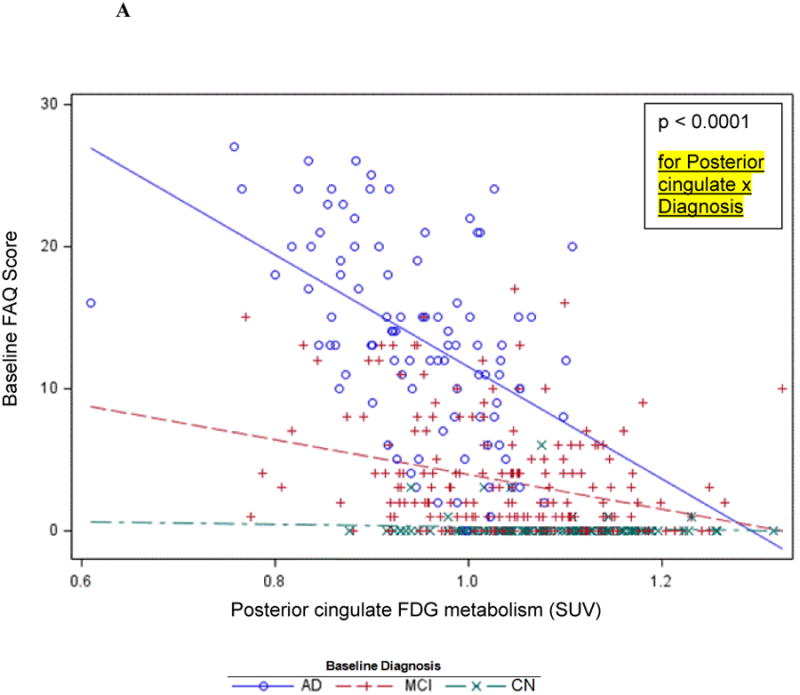

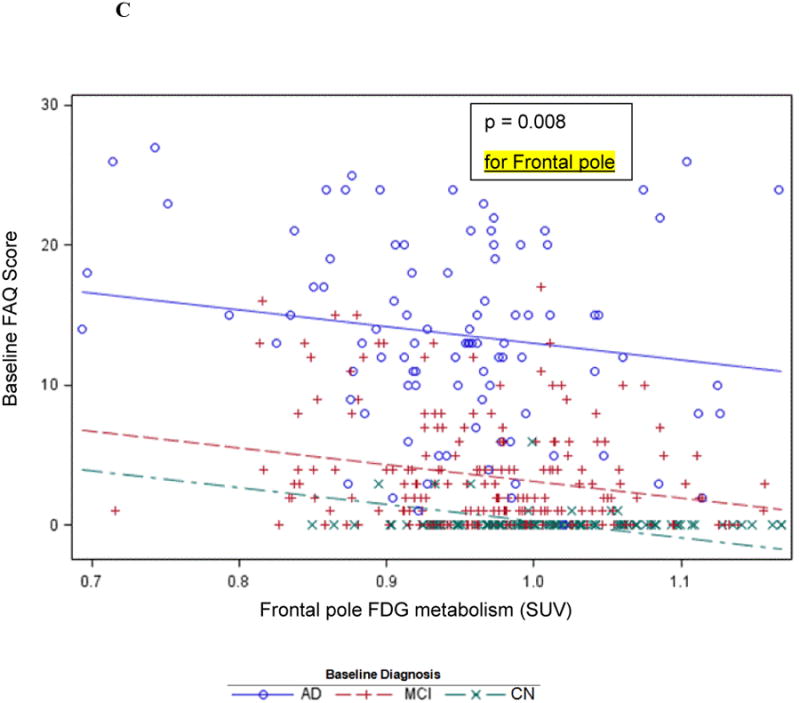
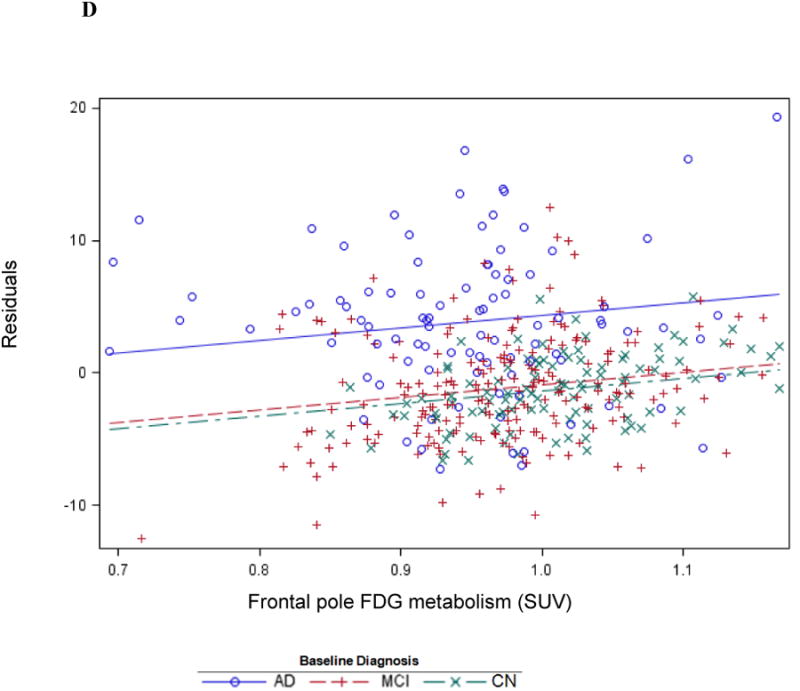
Cross-sectional graphs for predictor FDG ROIs and baseline diagnosis vs. baseline FAQ. Associations of FAQ with posterior cingulate (A), middle frontal (B), and frontal pole FDG metabolism (C and D) are shown. Actual observations (symbols) and values predicted (lines) by the indicated FDG ROI are shown (for simplicity, graphs are not adjusted for other predictors in the model, but those adjusted relations, if displayed, would be essentially the same as the ones shown). The indicated p value is that corresponding to the interaction or main effect for the FDG ROI as the case may be. The unadjusted association with frontal pole FDG (C) is contrasted with adjusted association in the reverse direction with all predictors except diagnosis × time residualized out first (D).