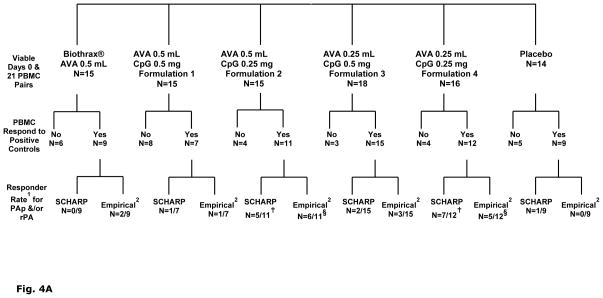
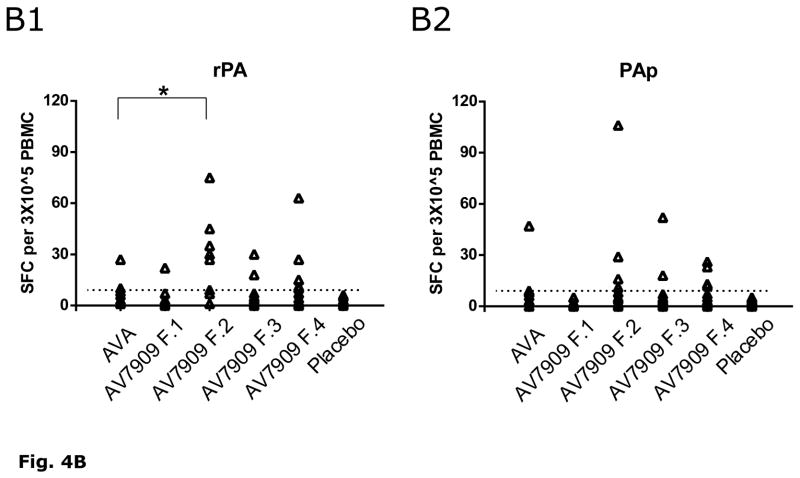
Fig. 4.
A). Break down of viable PBMC samples included in human IFN- γ ELISpot analyses and further paring according to functionally responsive to positive controls PHA or CEF I. Samples that failed to meet the CEF I or PHA cut-off definition (i.e. “No”) were excluded from subsequent statistical analyses. Group IFN-γ response rates to PA peptide pool and/or rPA: 1 For each Scharp or Empirical fraction, the numerator denotes number of subjects with positive IFN-γ responses to PAp and/or rPA; denominator denotes number of subjects with complete days 0 and 21 PBMC samples that met the CEF I (≥15 SFC) and PHA (≥200 SFC) cut-off criteria. 2 Empirical definition of positive response set at a minimum of 9 SFC in wells with PAp or rPA and at least two-fold higher than background (SFC counts in wells with medium alone). Scharp analyses to define positive responses was carried out at link http://www.scharp.org/zoe/runDFR/. Three subjects were excluded from final analyses due to insufficient cells for testing of either day 0 or day 21 samples. § p = 0.06 (responder rate from empirical analyses) and † p= 0.04 (responder rate from Scharp analyses) for AV7909 (with 0.25 mg CPG 7909; groups 3 and 5) compared to AVA alone, by Suissa-Shuster Exact test.
B). Individual subjects’ Day 21 (7 days after second immunization) IFN-γ ELISpot SFC counts following stimulation with rPA (B1) or PAp (B2). IFN-γ SFC counts per 3×10⁵ PBMC are shown in each Arm for those samples that met the cut-off criteria (i.e., those subjects included in the last row of Figure 4A as Responders (empirical) that had greater than 9 SFC (dotted line)). * A statistical difference (p < 0.05 following post-hoc analysis using ANOVA) for rPA SFC (but not PAp SFC) was identified for AV7909 (Formulation 2) relative to AVA.


