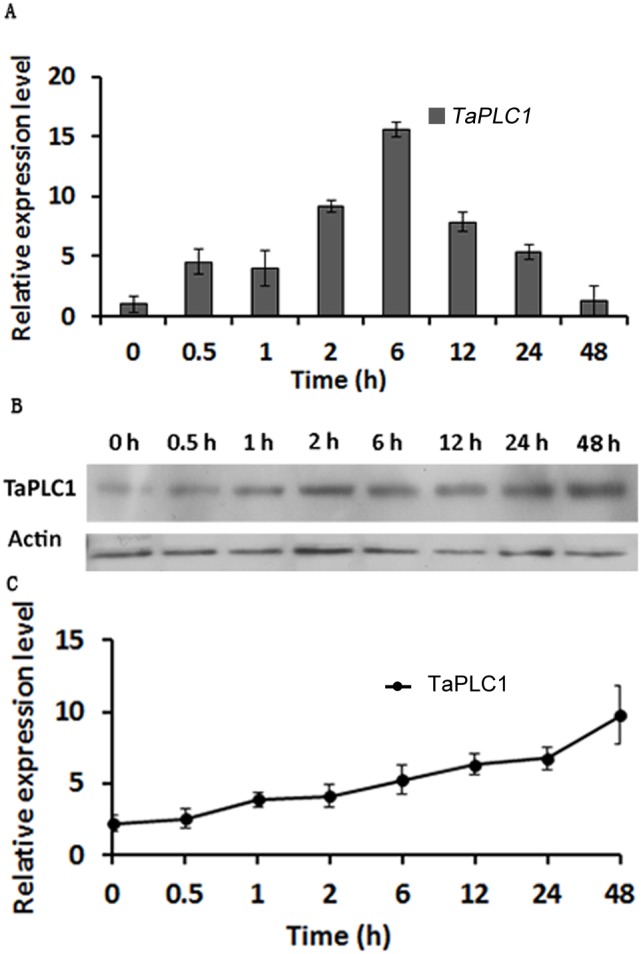
Figure 6. The TaPLC1 gene expression pattern under salt stress.

(A) The transcriptional expression pattern of TaPLC1 under salt stress. First-strand cDNA was synthesized from 1 µg of total RNA and used to perform real-time RT-PCR with gene-specific primers and 18S RNA as an internal control. Plants were analyzed after 0, 0.5, 1, 2, 6, 12, 24 and 48 h. The levels of expression were shown as relative to 0 h, which were set to 1.0. (B and C) The TaPLC protein expression pattern under salt stress. (B) Western blot analysis of TaPLC1 expression under salt stress. Anti-TaPLC1 antibodies were prepared as shown in Text S1 and Figure S1. Anti-actin antibodies were used as an internal control. (C) Plot of the average and standard deviation among three repeats.
