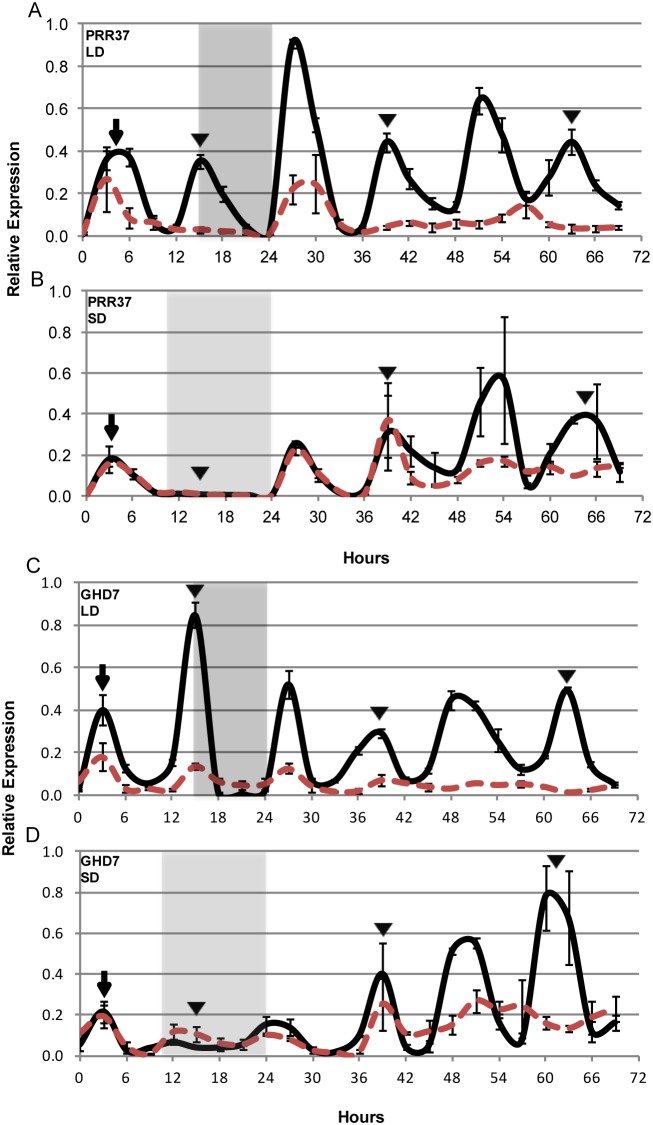
Figure 3. Relative expression of SbPRR37 and SbGHD7 in 100 M (Ma3/PHYB) and 58 M (ma3R/phyB-1) in LD and SD.
100 M (solid black line) and 58 M (dashed red line) plants were entrained LD (14 h light/10 h dark) or SD (10 h light/14 h dark) and sampled for one 24 h cycle, followed by 48 h in LL (continuous light and temperature). The grey background corresponds to time when plants are in darkness. Relative gene expression was determined every 3 hours by qRT-PCR. Arrows represent morning peaks of expression and arrowheads represent evening peaks of expression. (A) In LD, the second peak (arrowhead) of SbPRR37 expression in the evening (∼15 h) is missing in the phyB deficient line, 58 M. (B) In SD, the second peak (arrowhead) of SbPRR37 is absent in both 100 M and 58 M. (C) In LD, the second peak (arrowhead) of SbGHD7 expression in the evening (∼15 h) is attenuated in 58 M. (D) In SD, the second peak of SbGHD7 is attenuated in both 100 M and 58 M. Each data point of relative expression was based on data from three technical replicates and three biological replicates. Error bars indicate SEM.

