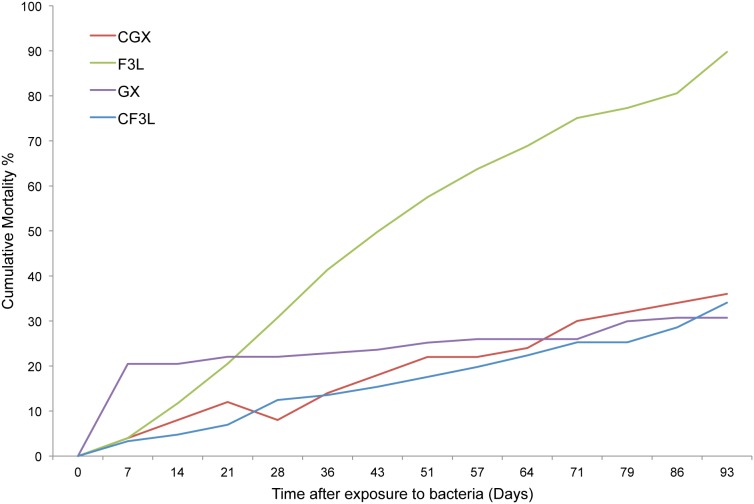
Figure 1. Mortality in resistant and susceptible oysters after challenge with Roseovarius crassostreae.
Cumulative percent mortality in resistant GX and susceptible F3L oysters following bacterial challenge compared to mortality in non-challenged (CGX, CF3L) oysters. Arrows on the x-axis indicate the timepoints at which RNA was isolated for RNA-seq.

