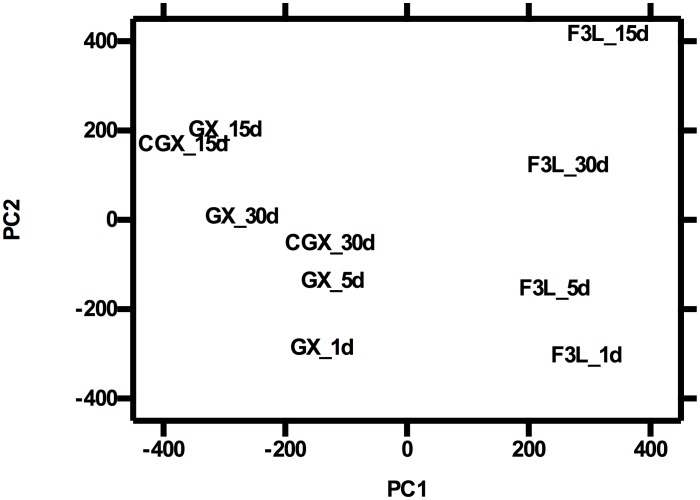
Figure 2. Principal components (PC) analysis of gene expression in resistant and susceptible oysters experimentally challenged with Roseovarius crassostreae: Spatial projection of PC1 and PC2.
The Z-score centered log2-transformed RPKM for each transcript in challenged susceptible oysters at days 1, 5, 15, and 30 after challenge (F3L_1 to F3L_30), challenged resistant oysters at days 1 to 30 (GX_1 to GX_30), and unchallenged resistant oysters at days 15 and 30 (CGX_15, CGX_30) was used in the PCA. Data from unchallenged resistant oysters at days 1 and 5 were not included in the analysis due to the potential confounding effect of an unrelated mortality event observed before day 7. Gene expression in unchallenged susceptible oysters (CF3L) was not studied.

