
Figure 3. Heatmap of differentially expressed transcripts in resistant and susceptible oysters experimentally challenged with Roseovarius crassostreae.
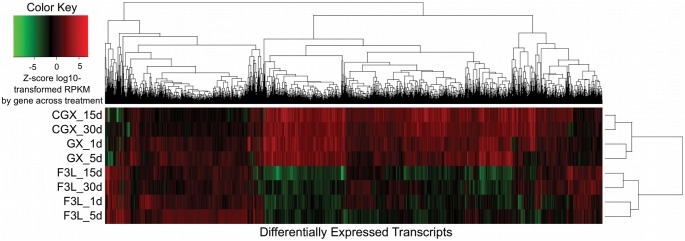
The Z-score centered log2-transformed RPKM for each transcript in each of eight sample groups is shown using a color scale. Genes are hierarchically clustered using Euclidean distance and complete linkage of the Z-score-transformed gene expression. Sample groups are clustered using the complete linkage Euclidean distance of the Spearman correlation of the Z-score-transformed gene expression.