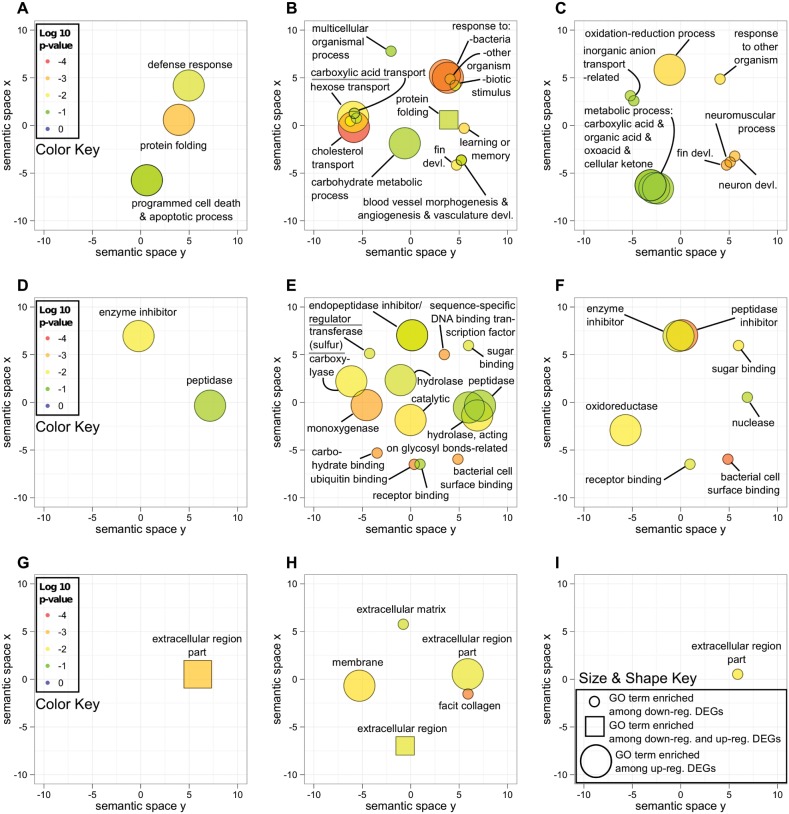
Figure 5. Functionally enriched Gene Ontology terms in the transcriptome of resistant and susceptible oysters in response to bacterial challenge.
Functionally enriched Gene Ontology (GO) terms among differentially expressed transcripts in resistant oysters at 1 and 5 days after bacterial challenge (GX_early, A, D, G), susceptible oysters at 1 and 5 days after bacterial challenge (F3L_early, B, E, H), and susceptible oysters at 15 and 30 days after bacterial challenge (F3L_late, C, F, I) are displayed for biological processes (A–C), molecular function (D–F), and cellular component (G–I). Each GO term category is represented by a shape (circle or square) in the same x,y location in each of the graphs. The color of the shapes from cool (green) to warm (red) signifies increasing significance of enrichment as indicated in the color key. The size of shapes reflects whether the GO term is enriched among up-regulated DE transcripts (large) or down-regulated DE transcripts (small), while a GO term enriched among both up-regulated and down-regulated transcripts is represented by a square shape. Overlapping shapes corresponding to functionally similar categories have been labeled using a more general term, noted by the suffix “-related”.

