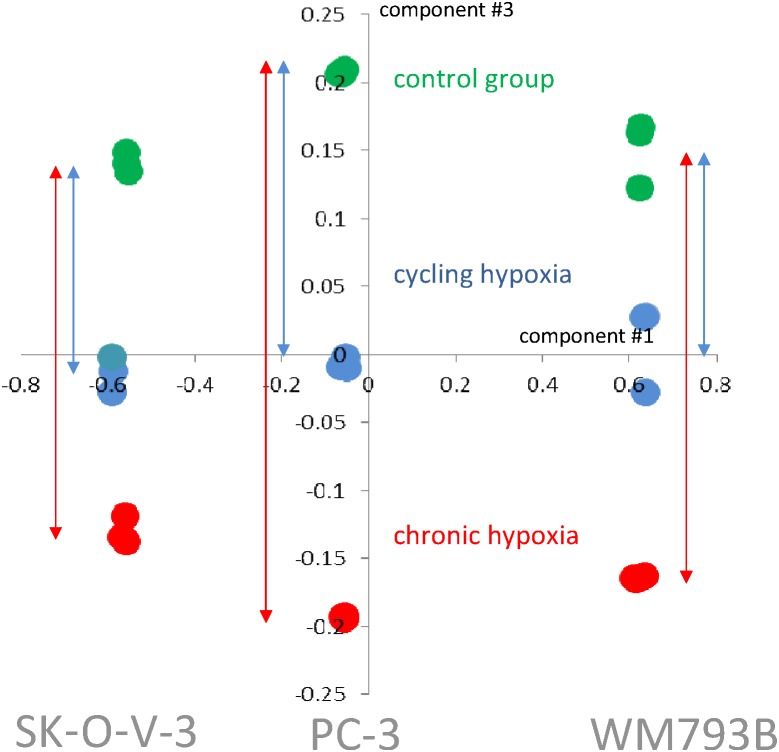
Figure 2. Unsupervised analysis of all samples by multidimensional scaling.
The scheme shows that the difference between molecular profiles of the analyzed cell lines is the main source of variance. The hypoxic stimulus is the second factor differentiating samples. The dots represent replicas of samples: control (green), chronic hypoxia-treated (red) and cycling hypoxia-treated (blue). The axes are titled: component #1 (the X-axis) and component #3 (the Y-axis).

