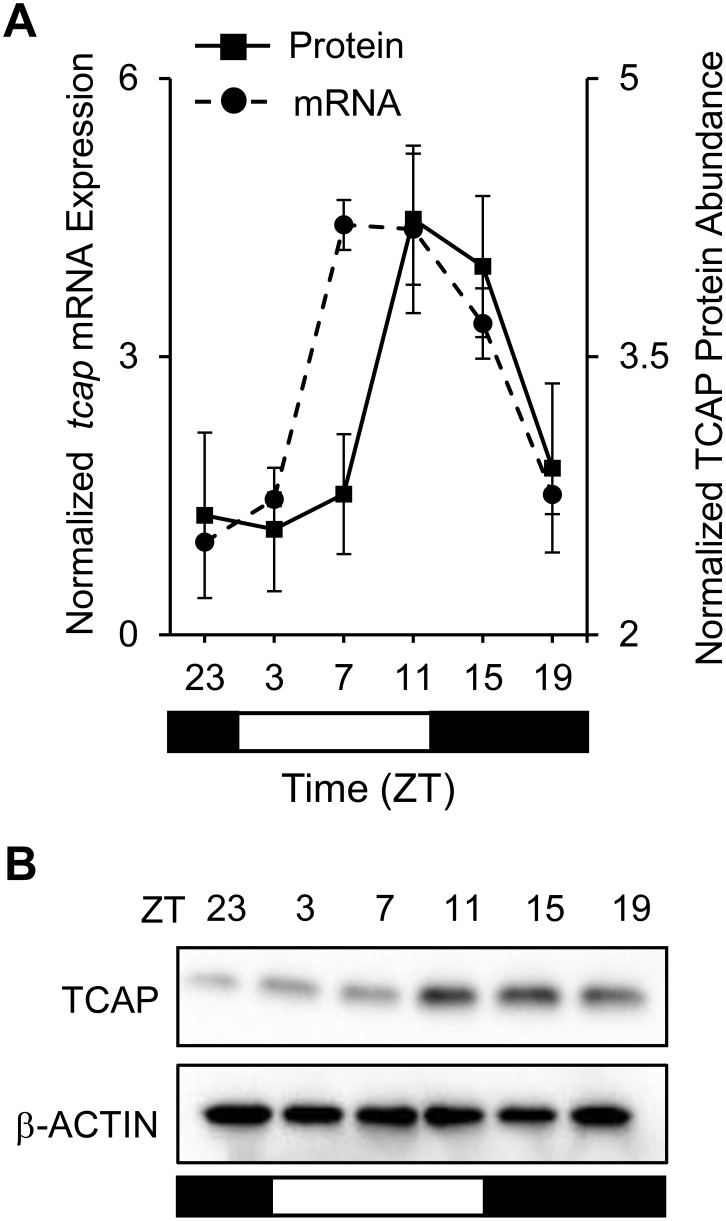
Figure 2. Diurnal cardiac Tcap mRNA and TCAP protein rhythms.
Hearts were collected every 4 h across the 12∶12 L:D cycle from C57Bl/6N mice, and used for qRTPCR (mRNA) or Western blot (protein) analysis. (A) Tcap mRNA (dotted line) exhibited rhythmic expression (JTK_Cycle, p = 7.41×10⁻⁵) with a peak in the light phase at ZT07 (murine sleep time) and trough in the dark phase (n = 3/time point). TCAP protein (solid line) also exhibited a rhythmic profile (JTK_Cycle, p = 0.00139) that peaked in the light and reached a nadir in the dark (n = 3/time point). There was a 4 h phase delay between mRNA expression and protein abundance. (B) Representative Western Blot, illustrating TCAP protein abundance over the 12∶12 LD cycle. The diurnal environment of 12 h dark (black bars, animal’s subjective wake time) and 12 h light (white bars, animal’s subjective sleep time) is illustrated by the bars below the graphs.

