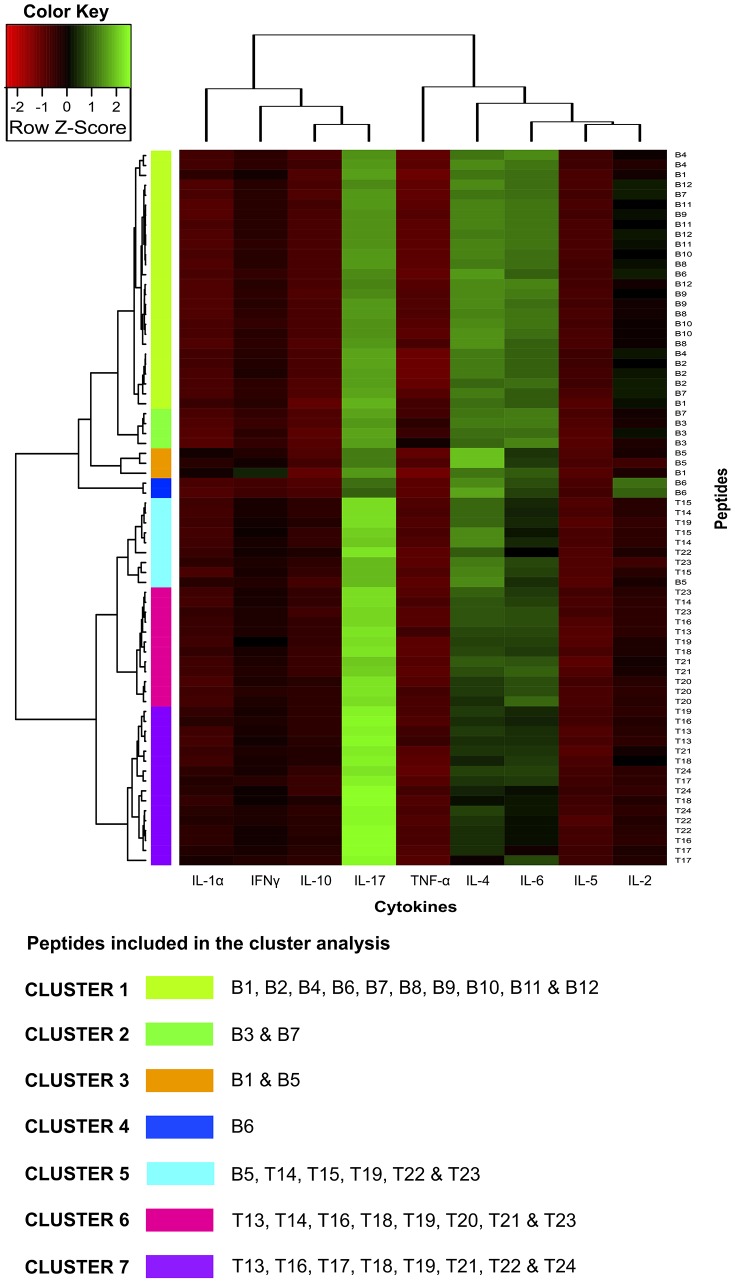
Figure 7. Individual cytokine expression levels are represented by shades of green to red on the central heatmap (highest values shown in green and lowest in dark red).
The right-hand margin provides the name of peptide sets. Rows and columns represent clusters of interleukins and peptides having a similar immunological response. A list of cytokines grouped within each cluster is also provided. Groupings having shorter distances (as indicated by the distance to k-means nearest group) had greater similarity. Bicluster analysis for B- and T-cell peptides formulated with the AA0029 immunomodulator. Seven major clusters can be discerned (1, 2, 3, 4, 5, 6 and 7), encompassing peptides having similar cytokine levels.

