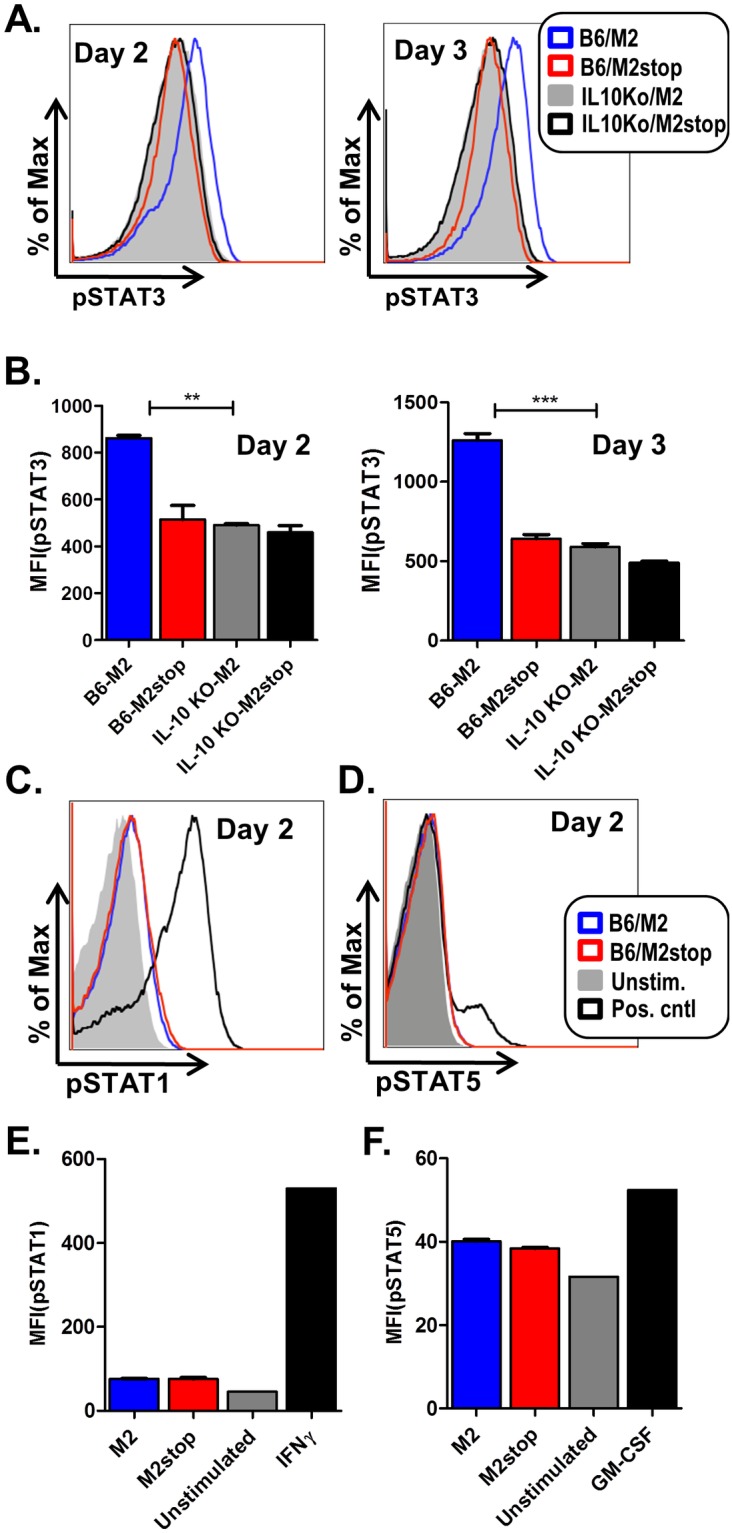
Figure 2. M2 induced IL-10 signals through positive feedback involving STAT3, but not STAT1 or STAT5.

(A–F) Primary B cells from either wild type C57BL6 (B6) mice or IL10−/− mice (as indicated) were transduced with retroviral vectors encoding either M2 or M2stop. On days 2 and 3 post transduction, the cells were analyzed by phosphoflow as described in materials and methods. (A) B cells from B6 or IL10−/− mice transduced as mentioned above were analyzed for pSTAT3 levels after gating on live cells by forward and side scatter characteristics. Representative histograms of pSTAT3 levels, one each on day 2 and day 3 are shown. (B) Mean Fluorescent Intensities (MFIs) of pSTAT3 fluorescence from three independent replicates are shown for each condition shown in A. (C–D) B cells from B6 mice transduced as mentioned above were analyzed for pSTAT1 or pSTAT5 levels, respectively. Positive control for pSTAT1 induction is IFNγ treatment of cells at 100 ng/mL for 15 minutes and positive control for pSTAT5 induction is treatment of cells with GM-CSF at 100 ng/mL for 15 minutes. Representative histogram from day 2 post-transduction for each condition is shown. (E–F) Mean Fluorescent Intensities (MFIs) of pSTAT1 or pSTAT5 fluorescence from average of three independent replicates are shown for each condition shown in C and D. The experiments were done at least three times with three replicates in each experiment.
