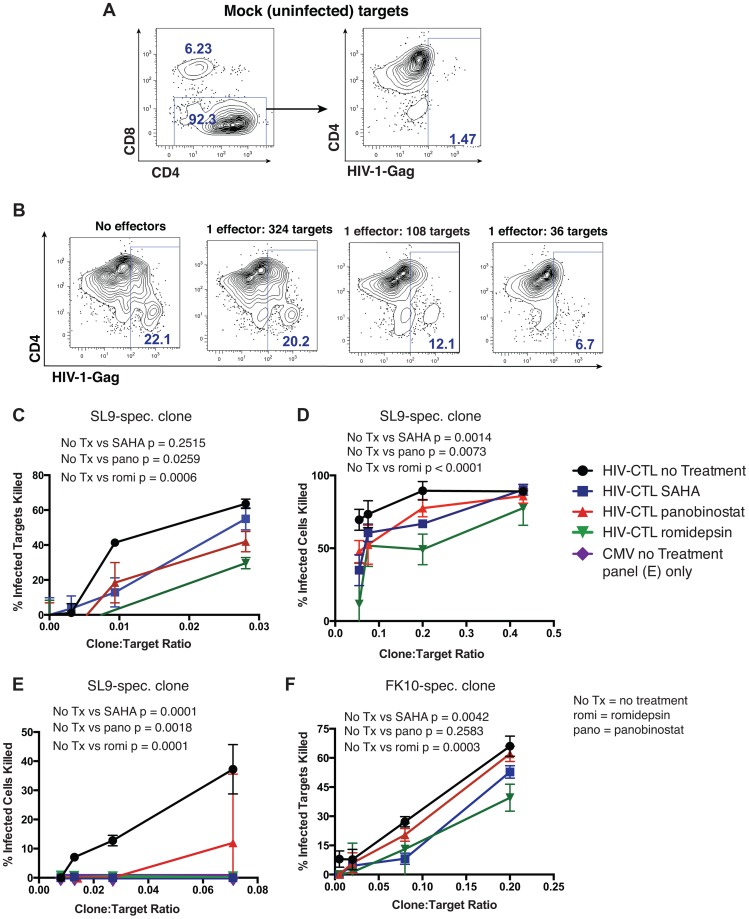
Figure 6. HDAC inhibitors impair CTL killing of HIV-infected primary CD4+ cells.
CD4+ T-cells were enriched from HIV-uninfected A02+ donors and either infected with HIV JR-CSF or maintained as mock infected controls. 24 hours post-infection, these target cells were co-cultured with an HIV-Gag- or CMV-pp65-specific CTL clones at the indicated effector (clone)∶target (CD4+ cell) ratios for 16 hours. Cells were then stained with fluorochrome conjugated antibodies to CD8, CD4, and HIV-Gag (intracellular staining) and analyzed by flow cytometry. A. Shown is the gating strategy utilized for killing assays, with the placement of Gag+ and Gag+CD4dim gates determined based on a mock-infected control (right panel). B. Data from a representative experiment with indicated effector∶target ratios of an HIV-Gag-SLYNTVATL-specific T-cell clone. Panels C-F utilize total Gag+ cells and calculate a % Infected Cells Killed as (%Gag+ No Effectors - %Gag+ at Given E∶T ratio)/%Gag+ No Effectors*100, ex. in panel B %Infected Cells Killed at 1∶36 ratio = (22.1−6.7)/22.1*100 = 69.7%. C–F. Shown are the results from 4 independent experiments. In C CTL were treated with romidepsin or panobinostat at 50 nM or with SAHA at 500 nM for 2 hours, and then co-cultured with target cells without a washing step. In D–F CTL were treated with romidepsin or panobinostat at 25 nM or with SAHA at 500 nM for 6 hours, then washed thoroughly before initiating a 16 hour co-culture with target cells. D and E both utilize an HIV-Gag-SLYNTVATL-specific CTL clone at high and low E∶T ratios respectively. E utilizes an HIV-Gag-FLGKIWPSHK-specific CTL clone. C–F. Shown are means ± SEM of data from triplicate wells. P values were calculated by two-way ANOVA with Tukey's multiple comparison test.

