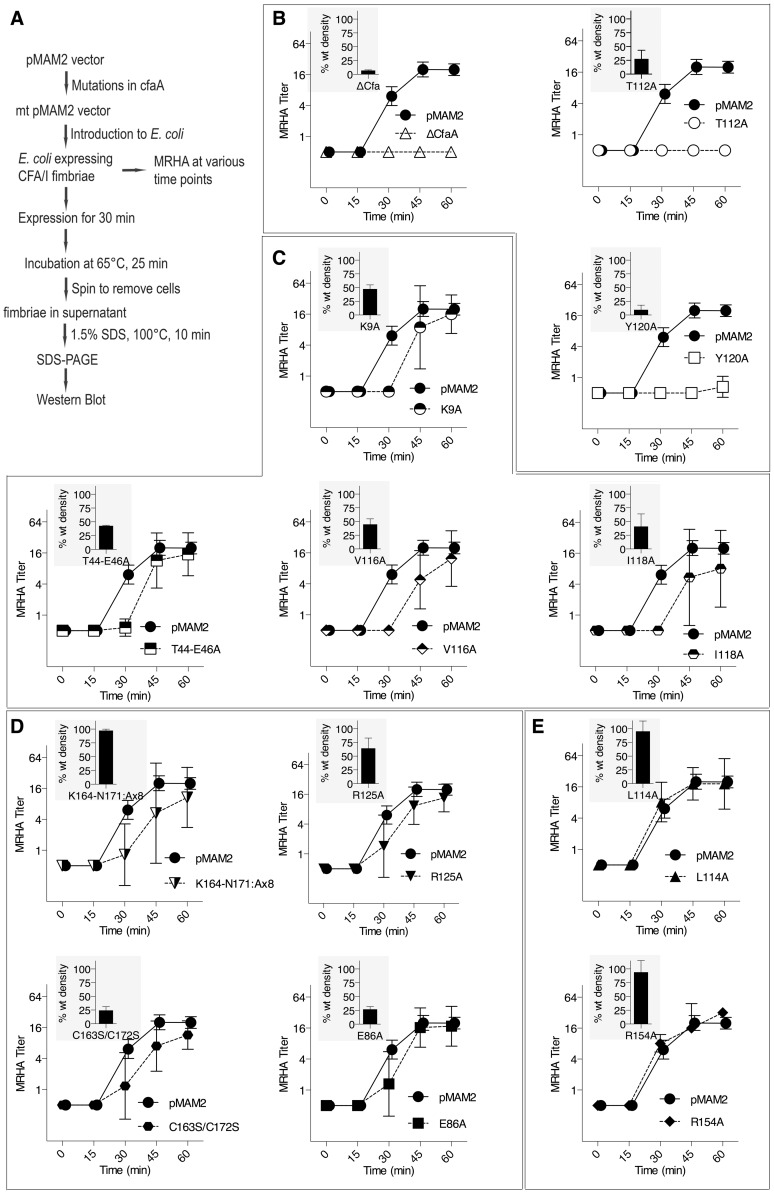
Figure 5. Effect of CfaA mutations on pilus pilus formation.
(A) Schematic description of the procedures followed to determine the amount of CFA/I pili on the surface of E. coli harboring the CFA/I operon with either wild type (pMAM2) or modified CfaA. (B–E) Paired graphs are shown for each mutant, showing the rate of acquisition of functional pili as determined by the MRHA assay (fprate) and (shaded graph insert in the upper left corner) the relative amount of surface-extracted CfaB after 30 minutes induction (piliation at 30 minutes [p30]). (B) A negative-control ΔCfaA mutation and two other modifications result in complete abolition of MRHA expression through 60 min of pilus induction and a correspondingly marked reduction in p30. (C) Four CfaA mutations exhibited delayed fprate, all of which also showed a lower p30 in comparison to that associated with wild type CfaA. (D) Four CfaA mutations exhibited equivocal results with one (CfaA/K164-N171:A×8) showing a lag in fprate compared to pMAM2 but wild type p30 levels; and the other three (R125A, E86A, and C163S/C172S) showed an fprate not significantly lower than CfaA wild type over time, but a p30 lower than that of wild type. (E) Two mutants (L114A, R154A) exhibited both an fprate and p30 that was not different from the CfaA wild type. MRHA titers are graphed as geometric mean titers ±95% confidence intervals. Anti-CfaB Western blot data at 30 minutes (p30) was graphed as the relative amount ([density mutant/density pMAM2]×100 ± SEM) of surface-extracted CfaB.

