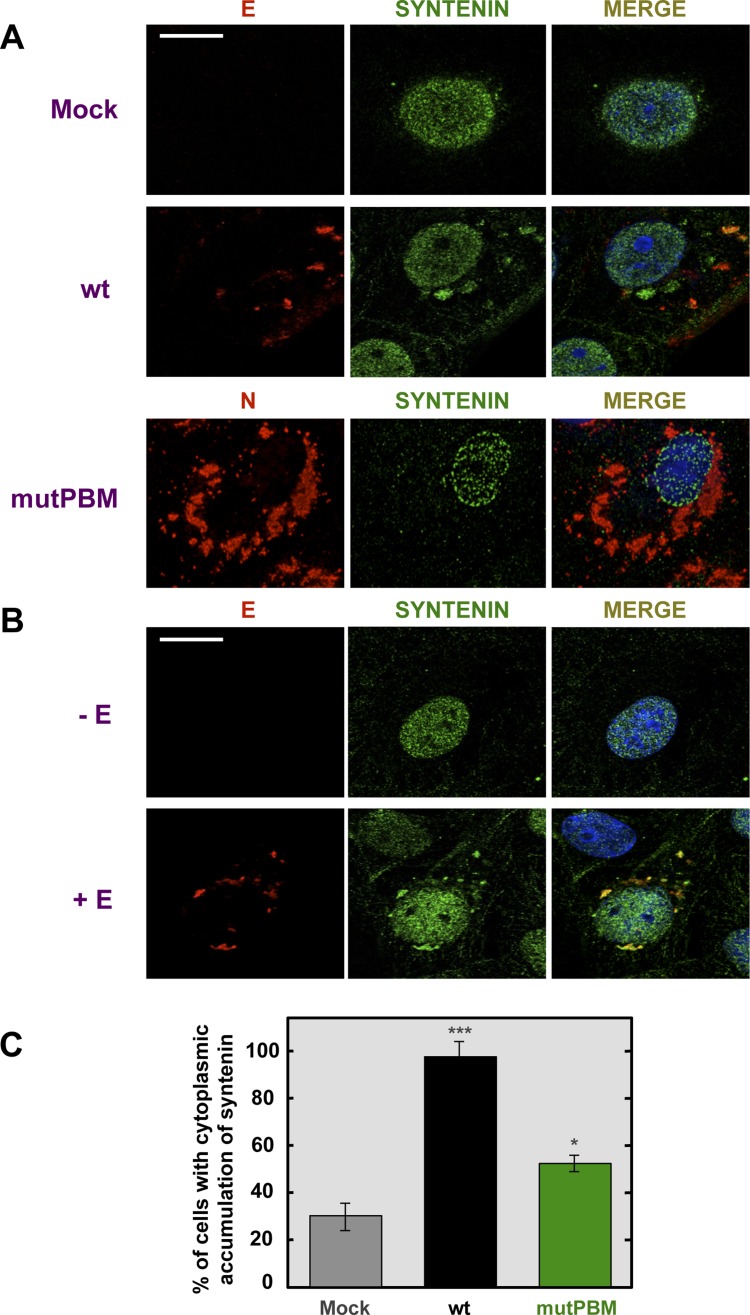
Figure 6. Colocalization of SARS-CoV E protein and syntenin in transfected and infected cells.
Vero E6 were mock-infected or infected with the wt virus at an MOI of 0.3 (A) or transfected with an empty plasmid (−E) or a plasmid expressing SARS-CoV E protein (+E) (B). At 24 hpi and 24 hours post transfection (hpt) for (A) and (B), respectively, cells were fixed with 4% paraformaldehyde and E or N proteins (red) and syntenin (green) were labeled with specific antibodies, nuclei were stained with DAPI (blue). Areas of colocalization of the two proteins appear yellow in the merged images. Scale bar = 10 µm. (C) Percentage of cells showing a cytoplasmic accumulation of syntenin after mock-infection or infected with wt or mutPBM viruses (n>50). Statistically significant data are indicated with one (P<0.05) or three (P<0.001) asterisks.

