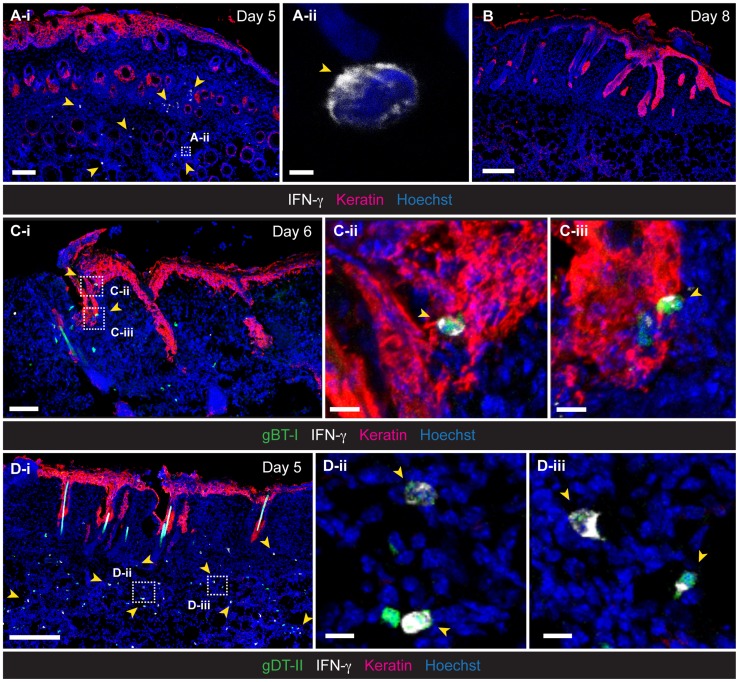
Figure 2. Localization of IFN-γ+ TEFF cells in infected skin.
IFM analysis of skin, 5 (A,D), 6 (C) and 8 (B) days post-infection, stained with anti-keratin and -IFN-γ antibodies, as indicated. (C,D) Detection of HSV-specific TEFF cells after transfer of GFP+ naïve gBT-I (C) and gDT-II (D) cells prior to infection. Scale bars: A-i, 100 µm; A-ii, 2 µm; B, 200 µm; C-i, 70 µm; C-ii, 10 µm; C-iii, 10 µm; D-i, 200 µm; D-ii, 10 µm; D-iii, 10 µm. Photos representative of n = 4–6 mice/group.

