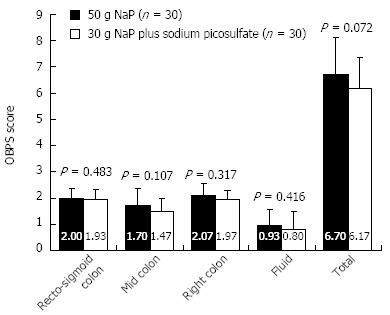
Figure 2.

The mean Ottawa bowel preparation scale scores. There was a trend toward a lower mean total score in the 30 g NaP plus sodium picosulfate group compared to the 50 g NaP group, but this difference was not statistically significant (Mann-Whitney’s U-test, P = 0.072).
