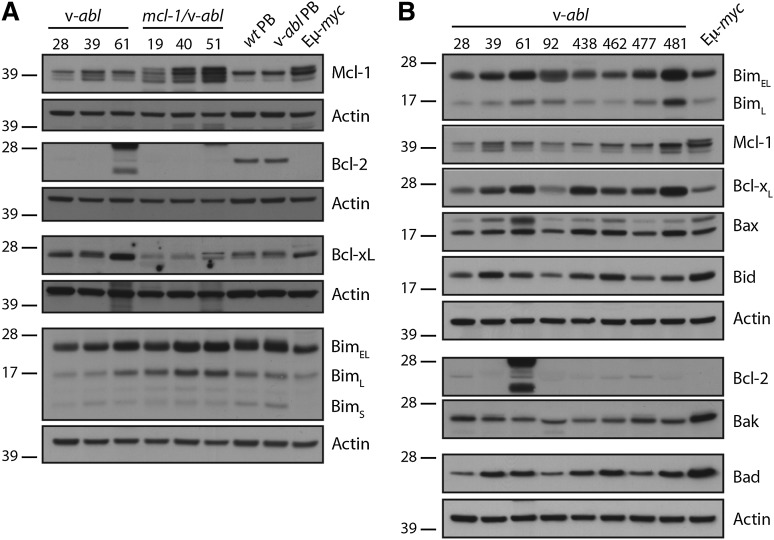
Figure 5.
Expression of Bcl-2 family proteins in plasmacytomas. Western blot analysis of the indicated plasmacytomas was performed using lysates prepared from snap-frozen tissue. (A) Plasmacytomas were compared with PBs generated in vitro by LPS stimulation of B cells from WT and v-abl mice (Figure 3) and Eμ-myc tumor 48 (which contains a floxed Mcl-1 allele encoding an additional 13 amino acids79). The mcl-1 transgene produces a FLAG-tagged Mcl-1 slightly larger than endogenous Mcl-1.18 (B) Comparison of a panel of v-abl plasmacytomas. See also supplemental Figure 3 for western blots on panels of mcl-1/v-abl and bim−/−v-abl plasmacytomas. MW markers are indicated (kDa). The Bcl-2 antibody cross-reacted with additional proteins in tumor 61, an IgG2b producer. Bcl-xL expression was compared within and between these blots, and those in supplemental Figure 3, using ImageJ 1.48v software (http://imagej.nih.gov/ij/). The Bcl-xL expression level was normalized to actin and then expressed relative to v-abl #39, which was run on all blots. From this analysis, 14 of 20 plasmacytomas had higher Bcl-xL than the 2 PB samples tested.

