
Figure 1.
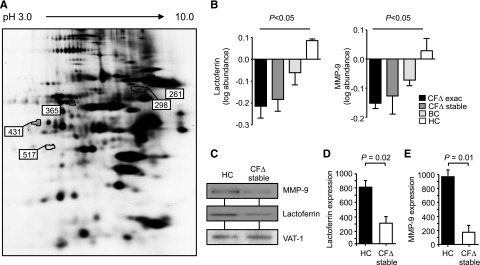
Intrinsic and inflammatory changes to proteins present on CF neutrophil membranes. (A) Comparative analysis of proteins extracted from membranes of ΔF508 homozygous PWCF during an exacerbation (CF∆ exac), the same individuals after exacerbation (CF∆ stable), HC, or non-CF bronchiectasis patient control cells (BC) was performed by 2D-DIGE. Differentially expressed proteins (numbered) illustrated within the representative 2D gel were analyzed by LC-MS/MS. (B) The log protein abundance illustrates persistent down-regulation of lactoferrin and MMP-9 on CFΔ exac and CFΔ stable, compared with HC and BC, samples (P < .05, 1-way ANOVA, n = 6 subjects per group). (C) Neutrophil membrane fractions from HC and CF∆ stable samples were subjected to sodium dodecyl sulfate-polyacrylamide gel electrophoresis and western blot analysis for MMP-9 and lactoferrin. By 2D-DIGE, VAT-1 was found equally expressed between the different membrane types and was therefore used as a loading control. Band intensity for (D) lactoferrin and (E) MMP-9 was quantified by densitometry and normalized to VAT-1 (P = .02 and P = .01, respectively, Student t test, n = 5 subjects per group). All measurements are means ± SEM from biological replicates.