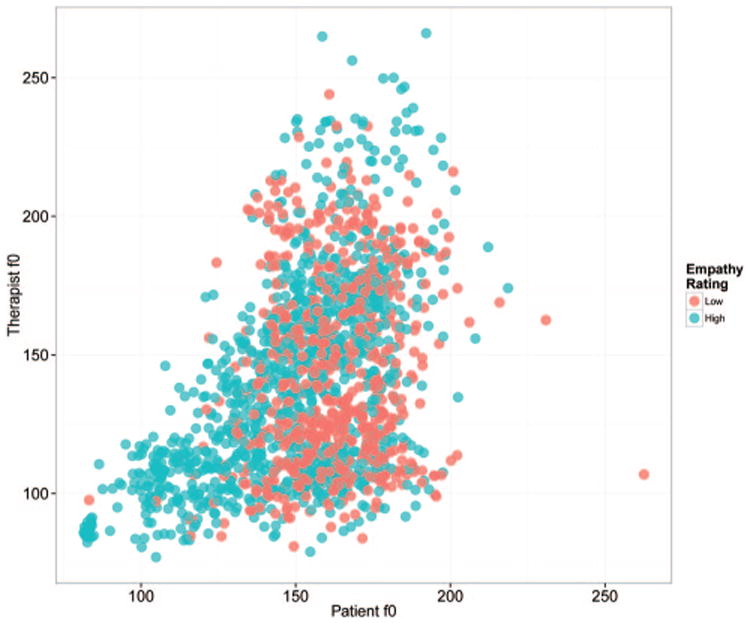
Figure 1.

Scatterplot of the covariation of therapist and standardized patient mean fundamental frequency (f0) across 1,775 min (from 89 sessions). Red points are from sessions with low-empathy ratings, and blue points are from sessions with high ratings. There were 1,826 potential min—71 min did not include either an SP or therapist observation (all values in Hz). Points are semitransparent to show overlapping observations.
