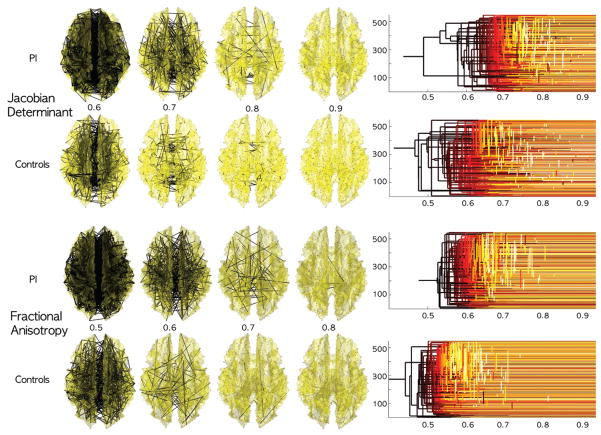
Fig. 2.
Networks
 (λ) obtained by thresholding sparse correlations for the Jacobian determinant from MRI and fractional anisotropy from DTI at different λ values. The collection of the thresholded graphs forms a filtration. PI shows more dense network at a given λ value. Since PI is more homogenous, in the white matter region, there are more dense high correlations between nodes. The filtration is visualized using the equivalent dendrogram [5], which also shows more dense linkages for PI at high correlations.

