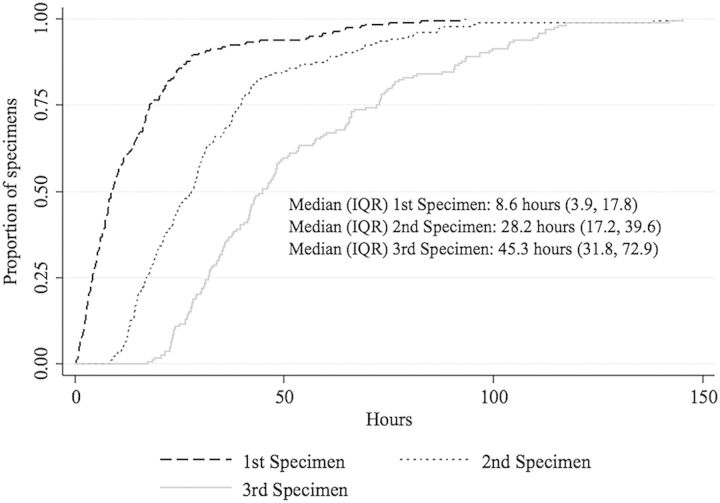
Figure 1.
Kaplan-Meier curve displaying time from airborne infection isolation initiation to laboratory receipt of the first (n = 201), second (n = 185), and third (n = 166) respiratory specimen(s). Failed sputum inductions were used to determine specimen order regardless of whether an induction time was available. Failed sputum inductions contributed time data to this Kaplan-Meier curve only when the induction time was available (n = 6). Abbreviation: IQR, interquartile range.

