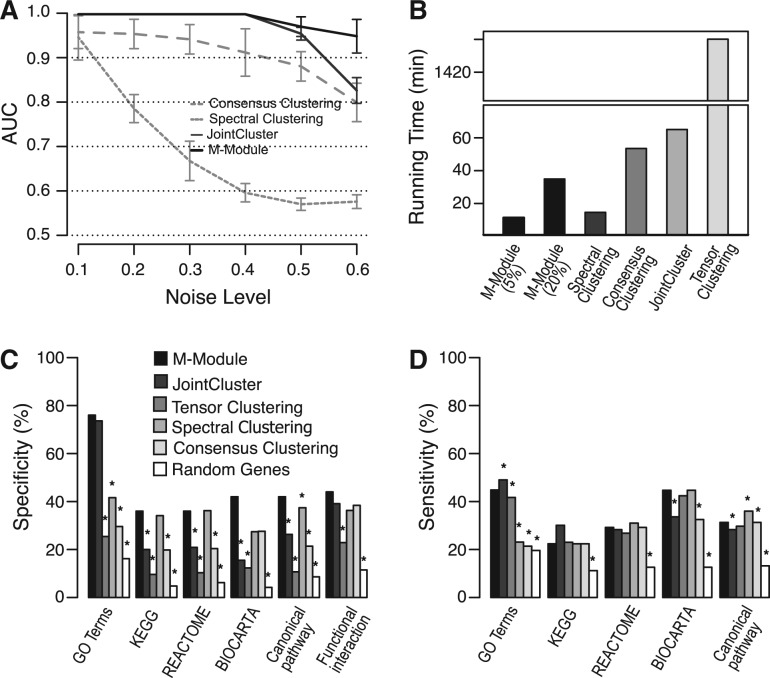
Fig. 2.
Performance assessment of M-module using simulated and real networks. (A) Performance as a function of the amount of noise in three simulated networks. AUC was used as the performance measure. Shown here are average AUC values of 50 runs of each method at each noise level. (B) Time complexity of different methods. Inputs are four gene co-expression networks constructed using breast cancer data. For M-module, two strategies were used to select seeds: top 5% genes as seeds and top 20% as seeds (in this case, >90% genes were covered by the discovered modules). (C) Specificity of the methods. Gene modules found by each method are evaluated by a set of gold-standard pathway annotations. Specificity is defined as the fraction of predicted modules that significantly overlaps with reference pathways. (D) Sensitivity of the methods. Sensitivity is defined as the fraction of reference pathways that significantly overlaps with predicted modules. Pathway overlap P-values were computed using hypergeometric distribution. P-values for the difference in specificity and sensitivity were computed using Fisher’s exact test. All P-values were corrected for multiple testing using the method of Benjamin–Hochberg. *P < 0.05

