
Fig. 3.
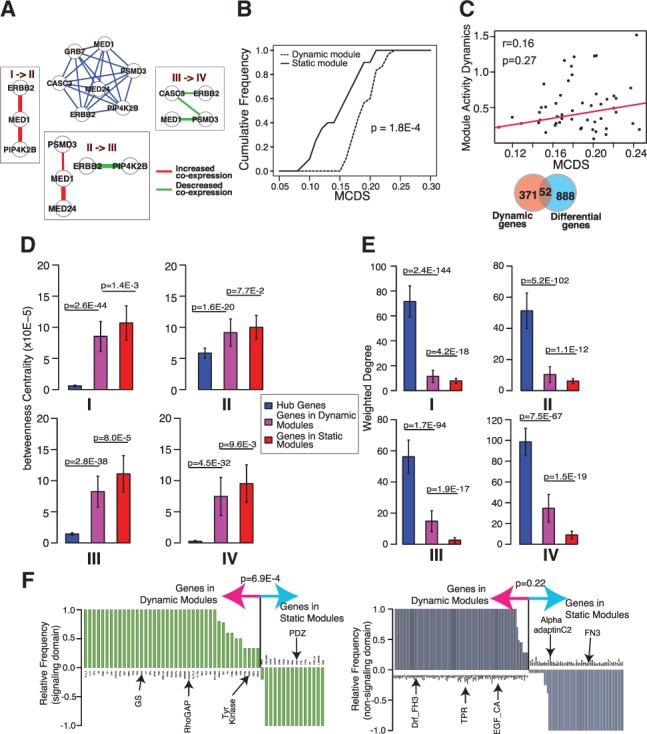
Evidence and properties of module connectivity dynamics across multiple networks. 4-modules were identified using co-expression networks representing four stages of breast cancer. (A) An example dynamic 4-module representing the Erbb2/Her2 signaling pathway. Middle subnetwork, composite 4-modules whose edges are the average co-expression correlations across four networks. Surrounding subnetworks, subnetworks induced by edges that show significant changes in values between two adjacent co-expression networks. (B) Cumulative distributions of connectivity dynamic scores of discovered 4-modules. MCDS, module connectivity dynamic score. (C) Module connectivity dynamics is not correlated with expression level dynamics of module members. Top, correlation between gene expression dynamics and gene connectivity dynamics of module members. Bottom, overlap between 4-module genes and differentially expressed genes. (D) Betweenness centrality of genes in 4-modules and hub genes. (E) Sum of edge weights of genes in 4-modules and hub genes. (F) Occurrence frequency of signaling (left) and non-signaling (right) protein domains encoded by 4-module genes