
Figure 3.
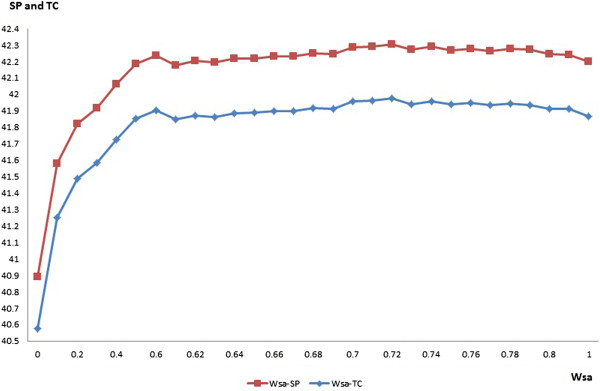
The plot of the SP and TC scores against different values of the weight of solvent accessibility (w sa ).
Official websites use .gov
A
.gov website belongs to an official
government organization in the United States.
Secure .gov websites use HTTPS
A lock (
) or https:// means you've safely
connected to the .gov website. Share sensitive
information only on official, secure websites.
The plot of the SP and TC scores against different values of the weight of solvent accessibility (w sa ).