Figure 6.

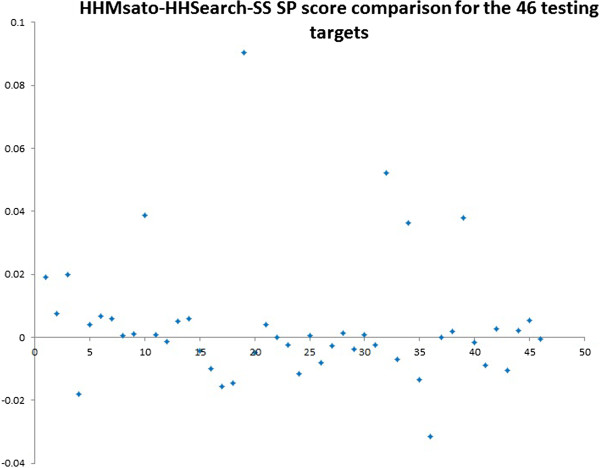
The plot of the average SP score difference between HMMsato and HHSearch-SS for the 46 testing protein targets. X-axis represents the index of the testing targets (1–46), and y-axis represents the score difference.

The plot of the average SP score difference between HMMsato and HHSearch-SS for the 46 testing protein targets. X-axis represents the index of the testing targets (1–46), and y-axis represents the score difference.