Figure 1.

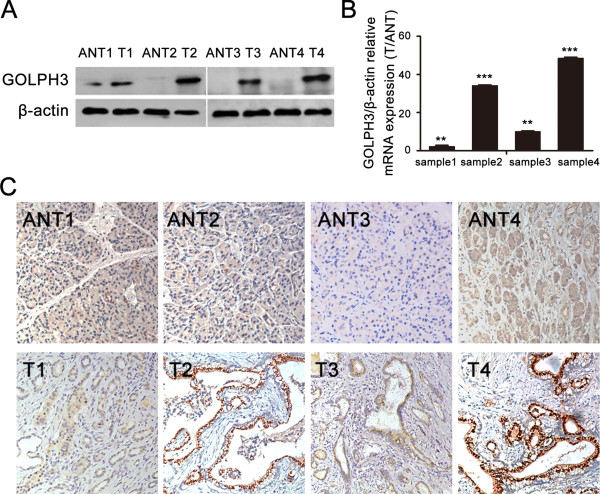
Expression of GOLPH3 is upregulated in pancreatic ductal adenocarcinoma (PDAC). (A) Western blots show the expression levels of GOLPH3 protein in four PDAC tumor tissues (T) and their paired adjacent noncancerous tissues (ANT); β-actin was used as loading control. (B) Real-time qPCR analysis shows the expression levels of GOLPH3 mRNA in PDAC tumor tissues relative to their paired adjacent noncancerous tissues (T/ANT). Values are given as a ratio of β-actin expression. **P < 0.01; ***P < 0.001. (C) Immunohistochemical staining shows the levels and localization of GOLPH3 protein in the four PDAC tumor tissues compared to their paired adjacent no cancerous tissues; (magnification, ×200).
