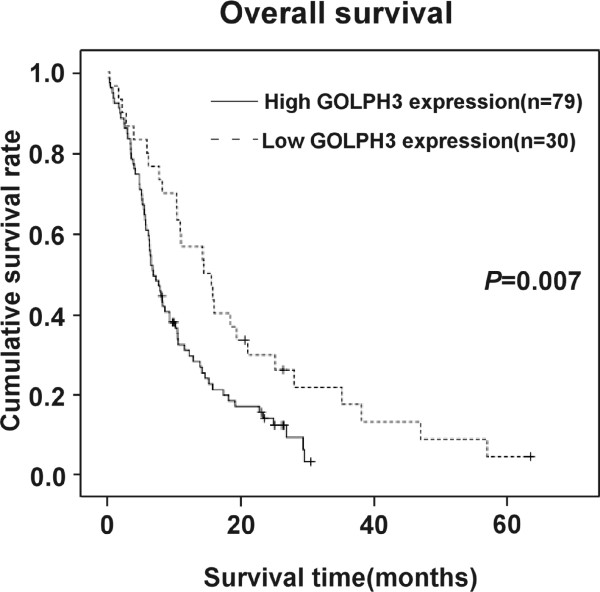
Figure 2.

GOLPH3 expression is correlated with overall survival in patients with PDAC. The Kaplan-Meier survival curves show the statistical differences in survival times between PDAC patients with high levels of GOLPH3 expression and those with low levels of GOLPH3 expression. P-values were calculated by log-rank test.
