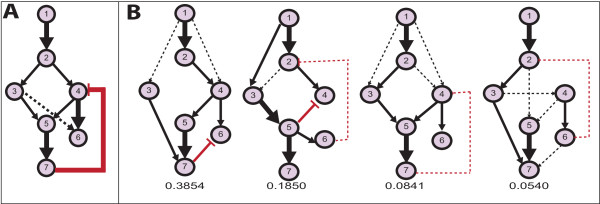
Figure 2.

Inference of negative feedback cycles. The Figure shows reconstructed network topologies on simulated data SN2, using the full data set (panel A) and partial data with observations only for proteins 6 and 7 (panel B). In the latter case, no unique network can be identified anymore. Clustering of sampled w groups topologies according to structural similarity. Only one cluster arises for the complete data (panel A), whereas four major different clusters arise on partial data (panel B). Shown are median networks from the four clusters, together with cluster probabilities computed as the fraction of networks in the cluster to the total number of sampled networks. Edge thickness indicates strength of support for the edge within the cluster (thick solid: >80% of samples within cluster, thin solid: >60%, dashed: >40% support), black lines indicate activations, red lines inhibitions.
