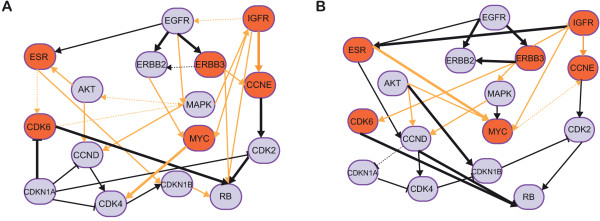
Figure 3.

Reconstructed ERBB-mediated signaling network. The plots show inferred network topologies for reverse phase protein array data acquired after stimulation of ERBB signaling and knockdowns of proteins involved in ERBB signaling. True positive edges, using high-confidence interactions in the STRING database as reference, are shown as solid black lines, newly predicted edges are shown as orange lines. True and false negatives are not depicted for the sake of readability of the plot. Edge thickness indicates strength of support for the edge (thick solid: >80% of samples, thin solid: >60%, dashed: >40% support). A: Network inferred without using any prior knowledge, B: Network inferred using the literature interactions reported by [34] as prior knowledge for network inference.
