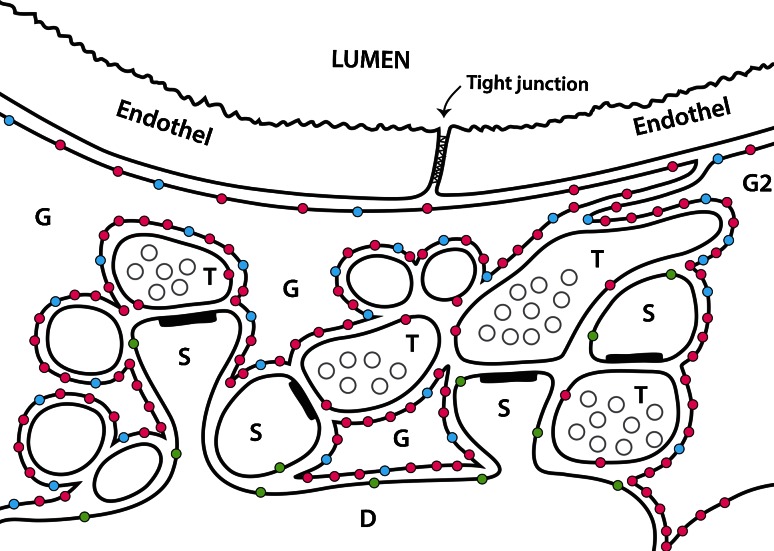
Fig. 1.
A schematic illustration of glutamate transporter distributions around synapses close to a blood vessel in the hippocampus. Four glutamatergic nerve terminals (T) are shown forming synapses onto dendritic spines (S). Astrocyte branches are indicated (G). Note that astrocytes have very high densities (Lehre et al. 1995; Ginsberg et al. 1995; Lehre and Danbolt 1998) of both EAAT2 (red dots) and EAAT1 (blue dots). The highest densities of EAAT1 and EAAT2 are in the astrocyte membranes facing neuropil, while the membranes facing the endothelium have low levels. Also note that glutamate transporters have not been detected in the endothelium. EAAT1 is selective for astrocytes (Lehre et al. 1995; Ginsberg et al. 1995), while EAAT2 is predominantly expressed in astrocytes (Danbolt et al. 1992), but there is also some (about 10 %) in hippocampal nerve terminals (Furness et al. 2008). EAAT3 (green dots) is selective for neurons, but is expressed at levels two orders of magnitude lower than EAAT2 and is targeted to dendrites and cell bodies (Holmseth et al. 2012b). Also note that the endfeet may actually overlap with no gaps in between them (Mathiisen et al. 2010) (Copyright: Neurotransporter AS; Reproduced with permission)

