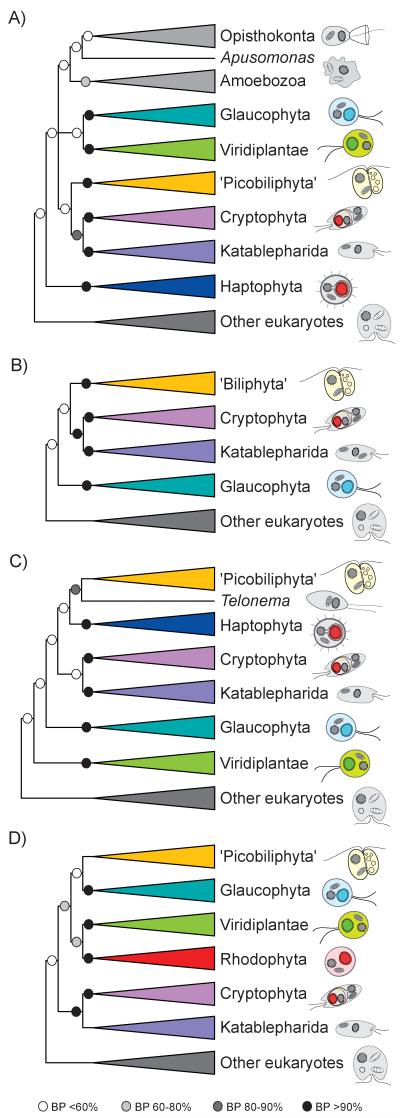
Figure 2.
Schematic phylogenetic trees showing the positions proposed for the ‘picobiliphytes’ by A: Not et al. [19], based on 18S rDNA sequence analyses; B: Cuvelier et al. [20], based on 18S rDNA sequence analyses; C: Yoon et al. [23], based on the analysis of 7 conserved proteins; and D: Burki et al. [26], based on the analysis of 258 conserved proteins. Circles at branches indicate the statistical support (bootstrap proportions, BP) found by maximum parsimony [19], maximum likelihood [20,23], and Bayesian inference [26],

