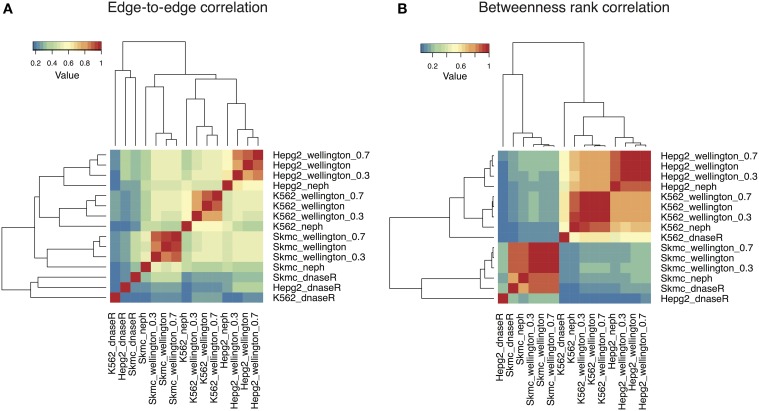
Figure 2.
Heatmaps summarizing the comparison among the TF-TF networks reconstructed with the sets of footprints obtained with DNaseR, Neph, Wellington in three different cell lines (K562, SkMC, HepG2). Networks obtained by running Wellington on 30 and 70% subsamples of aligned reads are also included. (A) Edge-to-edge correlation: DNaseR networks cluster separately; networks obtained with Wellington and Neph separate according to the cell type of origin. (B) The rank correlation of the betweenness centrality (a measure quantifying how many times a node is present in the shortest paths between two nodes) for the different networks show a comparable pattern, except that in this case K562 and HepG2 networks show much higher positive correlation between each other as compared to SkMC.

