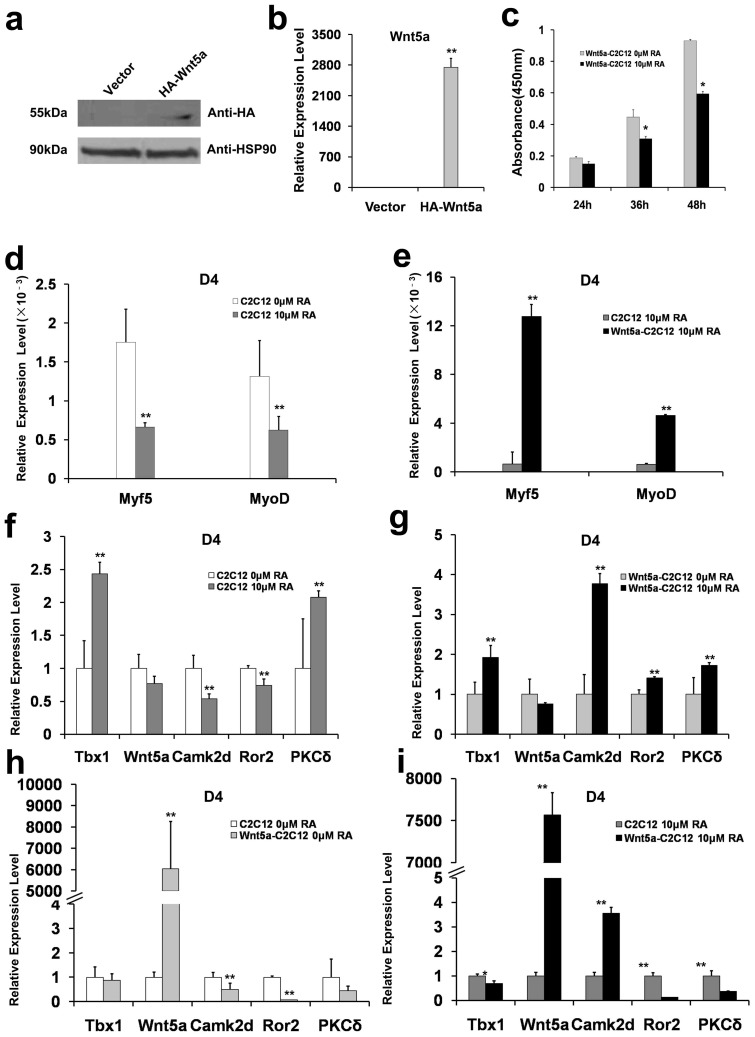
Figure 4. Western blot and qRT-PCR analyses of Wnt5a expression, and qRT-PCR analyses of Myf5, MyoD and related genes expression in differentiated C2C12 cells.
(a). Western blot analysis of HA-Wnt5a expression. C2C12 cells were transfected with empty vector (Vector) or expression vector encoding the HA-tagged Wnt5a (HA-Wnt5a). HSP90 was used as a sample loading control. (b) qRT-PCR analysis of the mRNA level of HA-tagged Wnt5a. (c) Proliferation of HA-Wnt5a-C2C12 Cells with and without RA treatment. Following the indicated RA treatments, optical density at 450 nm of the HA-Wnt5a-C2C12 cells decreased to 80%, 69% and 63% of the control cells, at the time intervals of 24 h, 36 h, and 48 h, respectively. The changes at 36 h and 48 h were statistically significant (n = 3, *P < 0.05). (d) Differentiated C2C12 cells were treated with or without RA (10 μM), and the mRNA levels of Myf5 and MyoD were determined by qRT-PCR at day 4 (D4). (e) Differentiated control C2C12 cells and HA-Wnt5a-C2C12 cells were treated with 10 μM RA, and the mRNA levels of Myf5 and MyoD were determined using qRT-PCR (D4). (f) Differentiated C2C12 cells were incubated with or without RA (10 μM), and the mRNA levels of Tbx1, Wnt5a, Camk2d, Ror2 and PKCδ were determined by qRT-PCR (D4). (g) Differentiated HA-Wnt5a C2C12 cells were treated with or without RA (10 μM), and the mRNA levels of Tbx1, Wnt5a, Camk2d, Ror2 and PKCδ were measured using qRT-PCR (D4). (h)–(i): qRT-PCR analyses of expression levels of Tbx1, Wnt5a, Cam2d, Ror2, and PKCδ in control C2C12 cells and HA-Wnt5a C2C12 cells (D4) under basal condition (h) and after RA (10 μM) treatment (i). All experiments were performed in triplicate, and ** denotes P < 0.01. In (a), the full length blots were presented in Supplementary Figure S3.

