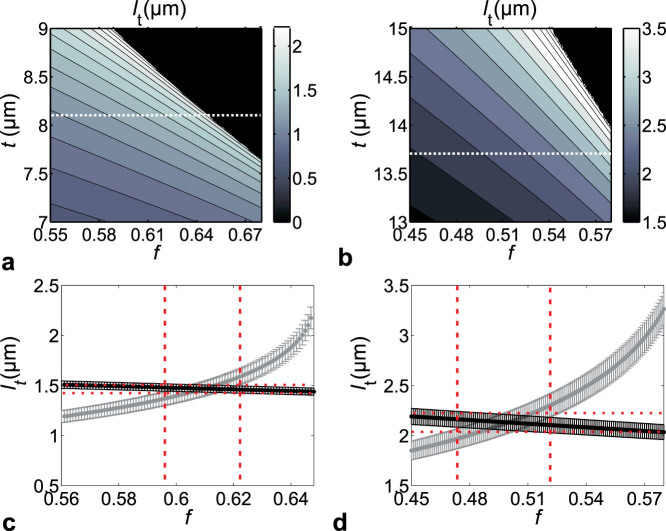
Figure 3. Transport mean free path in the scales.
(a,b), Transport mean free path ℓt as a function of filling fraction f of the chitin random network and scale thickness t calculated by equation 1 using measured τ-values, for Cyphochilus and L. stigma, respectively. The black areas correspond to unphysical solutions. ℓt is smaller than 5 μm in the relevant f and t range. (c,d), Corresponding variation of ℓt with f for fixed t (t = 8.1 μm and t = 13.7 μm for (c,d), respectively). The grey and black symbols correspond to the predictions of equation 1 and 2, respectively. The crossing points provide estimates of ℓt and f, delimited by the confidence range indicated by dashed lines.

