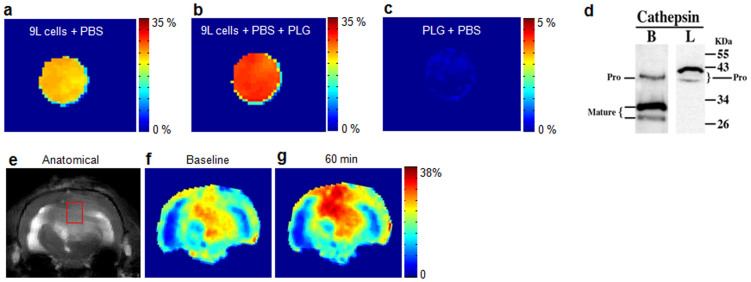
Figure 3. PLG as a marker of protease enzyme expression in cancer 9L cells.
(a). Cancer cells cultured without any PLG. This image shows ~22% CEST contrast, which is due to endogenous Glu in cultured cells. (b). Same cell line (as in a) cultured in the presence of PLG (20 mg/ml) for 1 hour shows an further elevation of ~17% of the CEST contrast over the baseline indicating that the CtB present in the tumor cells cleaved the PLG. (c). PLG alone in saline does not show any appreciable CEST effect owing to the slow exchange of amide protons present on the PLG. (d). Western blot analysis of tumor cell lysates shows both mature and pro form of CtB while cathepsin L (CtL) was expressed only in the pro form. The cleavage of PLG in this tumor cell line is predominantly due to CtB. (e), (f). Baseline anatomical CEST weighted image and CEST map from a rat brain with a 9L tumor. (g). At 60 minutes post intra-venous injection of PLG (160 mg/kg), a ~32% increase in GluCEST contrast was observed in the tumor region.

