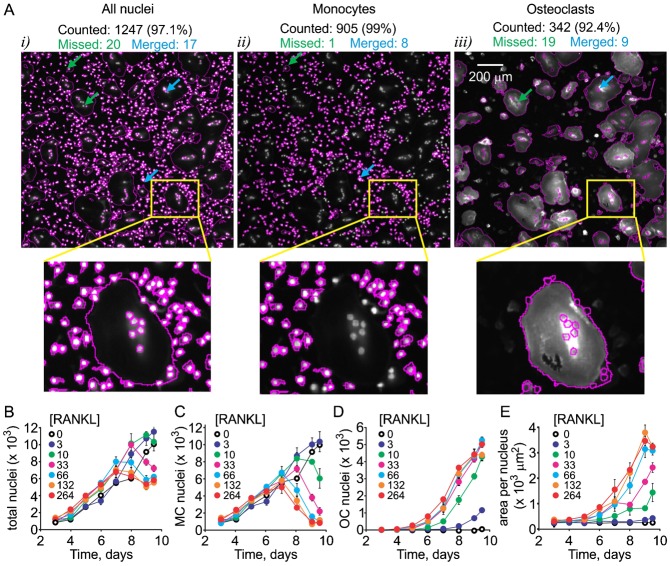
Fig. 3. Quantification of cellular dynamics using high content imaging.
Human osteoclast precursors were cultured with MCSF (33 ng/ml) and RANKL (0–264 ng/ml) for 3–9.5 days, fixed and stained for nuclei/cytoplasm (Whole Cell Blue)/αvβ3. (A) The quantification of total number of nuclei (i), monocyte nuclei (ii) and osteoclast nuclei (iii) was performed using a custom osteoclast quantification module for the open source software package ImageRail and validated manually. Scale bar is 200 µm. Total numbers counted are given in black, green arrows and numbers are nuclei missed by automatic quantification, blue arrows and numbers are merged nuclei miscounted by automatic quantification. The smaller images below are magnifications of a region indicated by a yellow triangle. (B–E) Time and [RANKL] dependences of changes in the total numbers of nuclei (B), numbers of monocyte nuclei (C), numbers of osteoclast nuclei (D) and cytoplasm area per nucleus (E) were obtained using high content imaging and automatic quantification. Data are means ± SEM, n = 6 replicates, representative data from 1 of 4 independent experiments are shown. Two-way ANOVA indicates significant (p<0.0001) effect of time and RANKL concentration as well as significant interaction between these factors for all 4 experimental outcomes.

