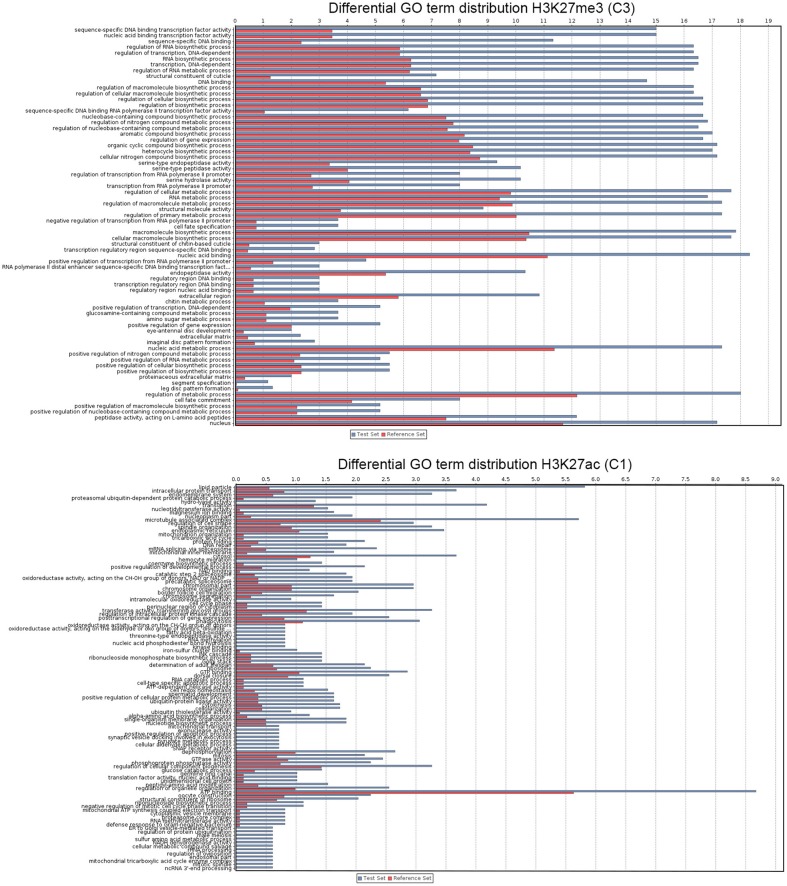
Figure 3.
Functional analysis of A. gambiae genes. The graphs show GO terms significantly associated with genes that show significant enrichment or depletion of H3K27ac and H3K27me3 at high levels (see Figure 2). Bars corresponds to number of sequences associated with each GO term. In the case of genes marked with H3K27ac from cluster 1 due to the number of records only most significant GO terms are shown (see Table S2 for the complete list).

