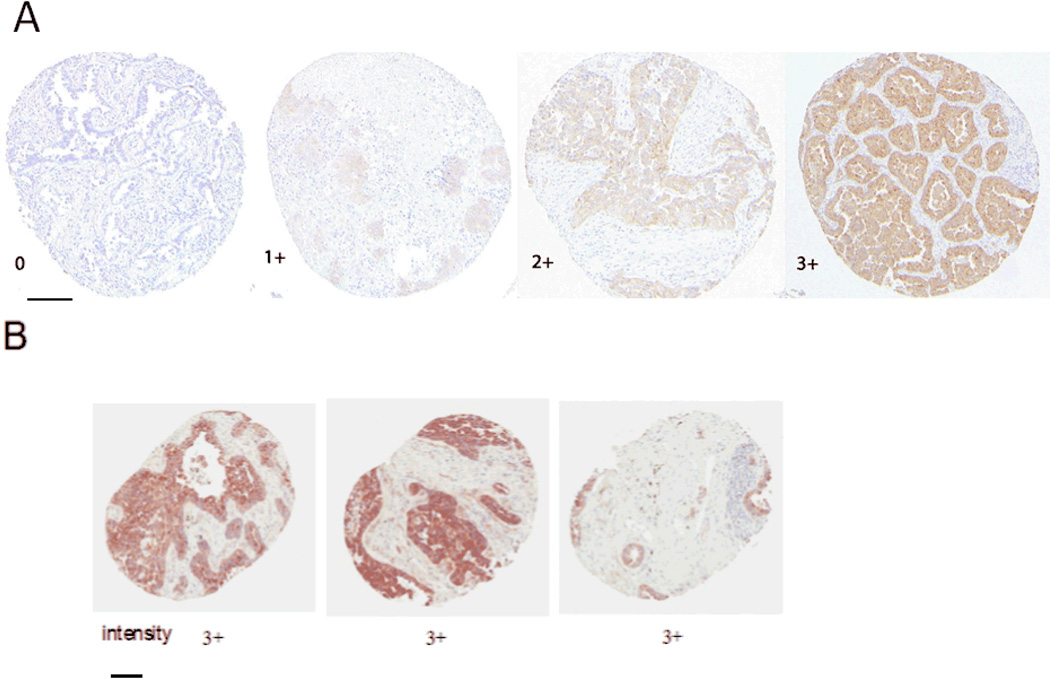
Figure 1. Immunohistochemical analysis of FAK expression in stage I NSCLC TMA samples.
FAK expression was detected by immunohistochemical staining with FAK 4.47 monoclonal antibody using TMA samples with triplicate tissue cores per tumor stained. Scale bars shown represent 150 micrometers in length. Images taken under x20 magnification. Figure 1 A shows representative images of scoring system that measured intensity (0, none; 1+, weak; 2+, moderate; 3+, strong. Figure 1B shows representative triplicate core showing extent of staining which represented the number of cores with a positive staining (extent 0, no staining in three cores; 1, only one core had a positive staining, mild; 2, only 2 cores had a positive staining, moderate; 3, all three cores had the positive staining, diffuse). In this example, the “extent” score is 3. The total FAK score including the measured intensity is 6.

