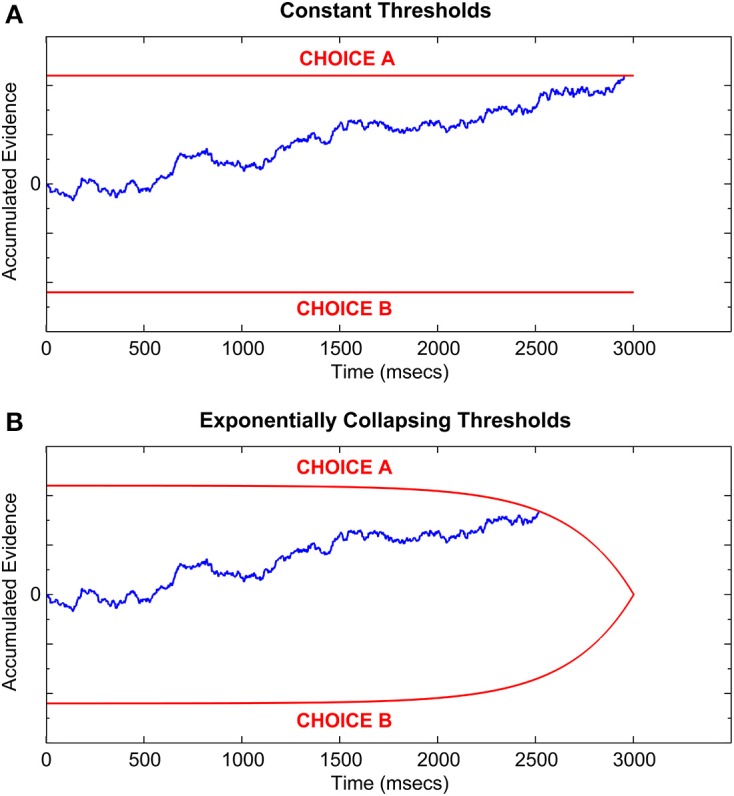
Figure 2.

Sample Drift-Diffusion process with (A) constant thresholds, and (B) exponentially collapsing thresholds which meet at a hypothetical deadline of 3000 ms. Red lines represent the two decision thresholds; blue line represents the evidence accumulation process [identical in both (A,B)]. Threshold crossing time represents the decision time. Total RT equals decision time plus non-decision latency.
