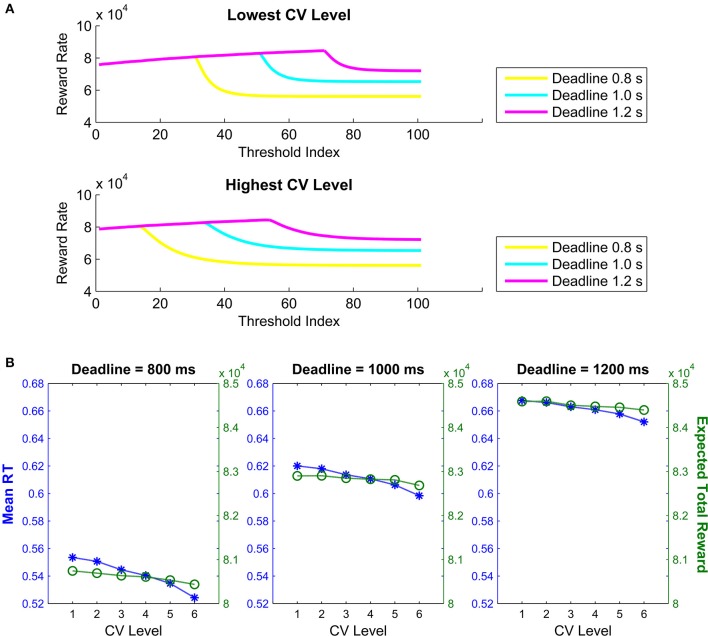
Figure 5.
(A) Expected total reward amount for the highest and lowest CV levels as a function of the order of threshold among the 101 thresholds tested (here defined as “Threshold Order”). (B) Mean response times and expected total reward amounts as a function of six levels of CV defining six exponential threshold collapse trajectories for the short (800 ms), medium (1000 ms) and long (1200) simulated deadlines. Both (A,B) are based on expected total reward as the optimality criterion.

