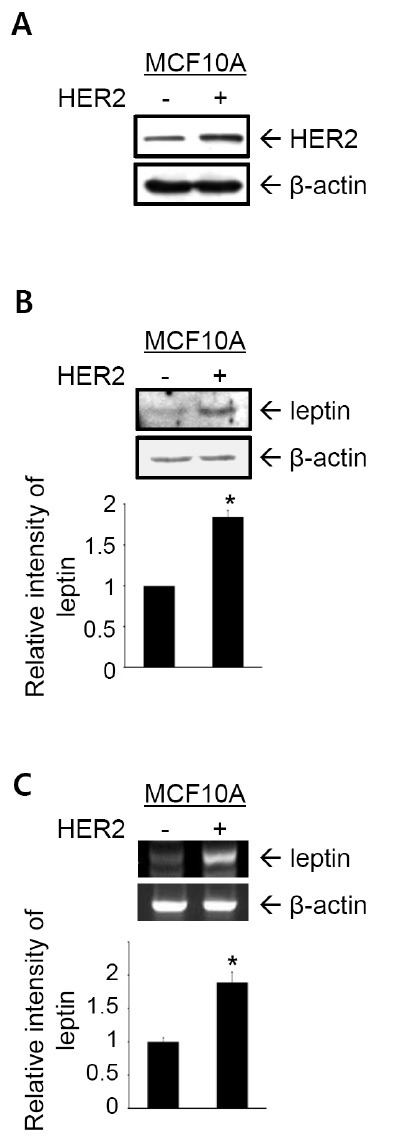
Fig. 1. HER2 induces leptin expression by transcriptional activation. (A) HER2 expression was detected in cell lysates by immunoblot analysis. β-actin was used as the loading control. (B) Leptin expression was examined by immunoblot analysis. (C) Leptin mRNA level was detected by RT-PCR analysis. β-actin was used as the loading control. Band intensities were quantified and plotted. The results are means + S.E. of triplicates. *Statistically different at P < 0.05.

