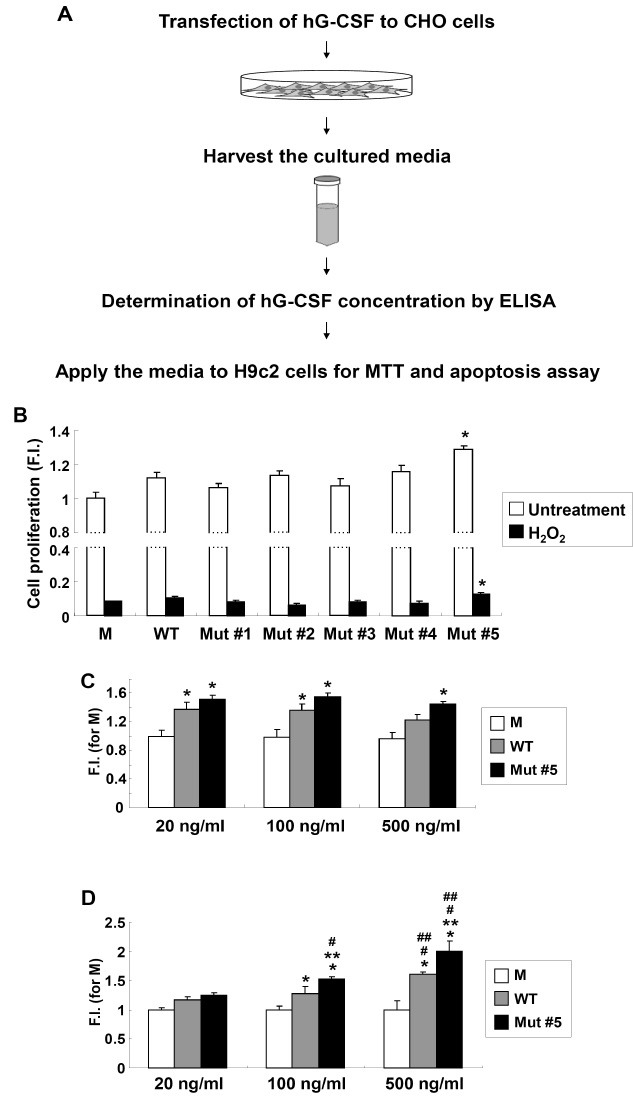
Fig. 2. Enhanced viability of H9c2 cells upon mutant hG-CSFs treatments. (A) Overall scheme for the enhanced biological activity test of the generated hG-CSF. (B) H9c2 cell proliferation assay in mutant hG-CSFs treatments after 24 h (white bar) and upon 1 mM H2O2 treatment (black bar). Absorbance for MTT assay was evaluated at 550 nm and the reference filter was 655 nm. The data represent the means from 3 sets of experiments performed in triplicate; error bars indicate standard deviation. Asterisks (*) indicate values that were significantly different (P < 0.05) from those of WT. M: control (CHO cell culture media transfected with an empty vector, pCMV-Tag4); F.I.: fold increase compared to M. (C) Cell proliferation assay for differential doses of hG-CSF WT and mutant #5. Cells were treated with the designated concentration for 48 h. (D) Cell viability test for differential doses of hG-CSF WT and mutant #5 upon 1 mM H2O2 treatment. Asterisks (* and **) indicate values that were significantly different (P < 0.05) from those of M and WT in the same concentration, respectively. Hashes (# and ##) indicate P < 0.05 in a comparison with 20 ng/ml and 100 ng/ml treatments, respectively.

