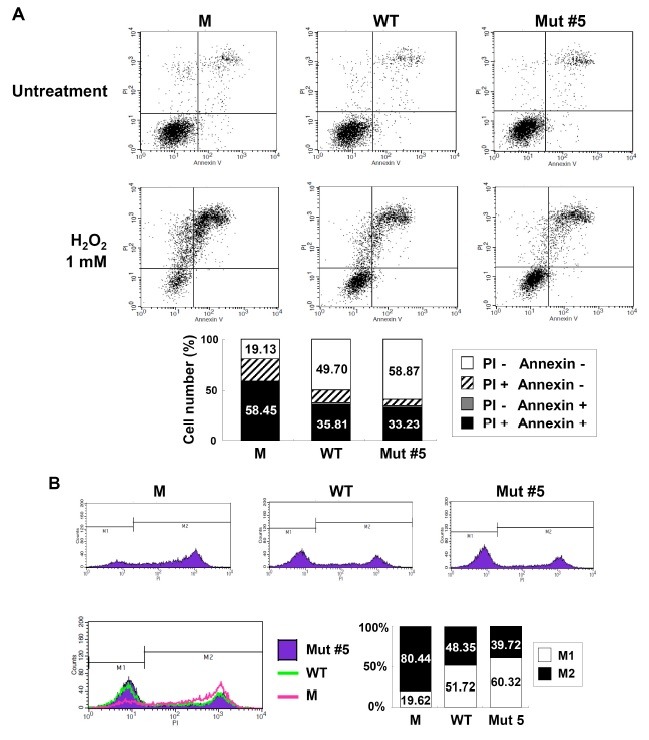
Fig. 4. Visualization of apoptotic activity in cells treated with Mut #5. (A) Results from flow cytometry analysis used to visualize the amount of apoptotic activity in the control (M), WT, and Mut #5 hG-CSF cells stained with Annexin V and PI. The histogram in the lower panel provides a comparison between the total number of apoptotic cells (black and gray bars) and surviving cells (white bars). (B) Results from the FACS analysis comparing the number of live (M1, white bars) and dead (M2, black bars) cells among the 3 treatments.

