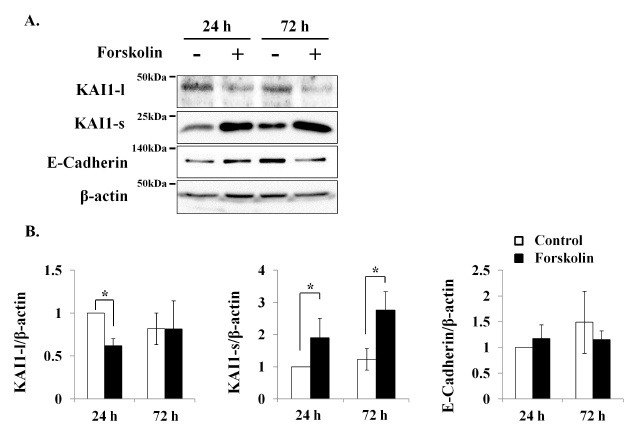
Fig. 3. KAI1 was increased during trophoblast differentiation. BeWo to trophoblast differentiation was induced with forskolin (50 μM). At 24 or 72 h after treatment, total proteins were prepared and KAI1 expressions were determined by Western blotting (A). KAI1-l and KAI1-s indicate large 47 kDa and small 23 kDa KAI1, respectively. The relative expression levels of KAI1-l, KAI1-s, and E-cadherin were quantified densitometrically and normalized versus β-actin (B). Empty and black bars indicate control and forskolin treatments, respectively. Graphs were presented as means ± SD of three independent experiments. *P < 0.05.