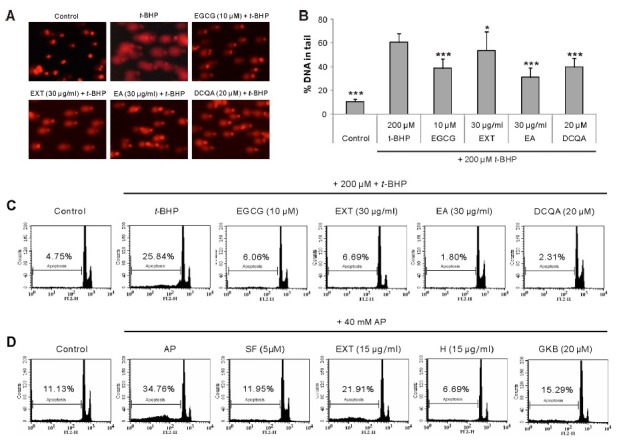
Fig. 3. Effect of G. koraiensis on the DNA damage and the sub G0/G1 content in HepG2 cells damaged by tert-butyl hydroperoxide (t-BHP) or acetaminophen (AP). (A, B) The oxidative DNA damage was determined by using comet assay. Cells were pre-treated with the extract (EXT, 30 μg/ml), the ethyl acetate fraction (EA, 30 μg/ml), or 3,5-di-O-caffeoylquinic acid (DCQA, 20 μM) for 24 h. The cells were treated with t-BHP (200 μM) for another 1 h. (A) Fluorescence microscope images. (B) The percentage of DNA in the tail, the index of DNA damage, was calculated using comet image analysis software. The data are representative of three independent experiments. Each bar represents the mean ± SD (n = 30). *P < 0.05, ***P < 0.001, significantly different from t-BHP treatment. (C, D) The sub G0/G1 content was measured by using flow cytometric DNA content analysis. HepG2 cells were pre-treated with EXT (15 and 30 μg/ml), the EA fraction (30 μg/ml), the hexane fraction (H, 15 μg/ml), DCQA (20 μM), or gymnasterkoreayn B (GKB, 20 μM) for 24 h. The cells were treated with t-BHP (200 μM) for 3 h or AP (40 mM) for 24 h. The data are representative of three independent experiments.