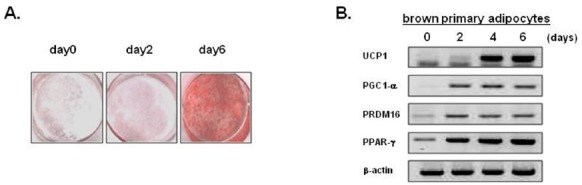
Fig. 1. Brown adipogenic differentiation of mouse primary preadipocytes. (A) The accumulation of lipid droplets in the cells was measured using Oil-red O staining. (B) The mRNA expression levels of brown adipocyte-specific markers, in this case UCP-1, PGC-1α, PRDM16 and PPARγ, were analyzed in a RT-PCR analysis. The total RNA was extracted on the indicated days of differentiation. β-actin was used as a loading control.